
-
Basic Statistics
Basic Statistics
Probability Theory
Mutually Exclusive Events and Overlapping Events
Objective and Subjective Probabilities
Conditional (Posterior) Probability
Independent Events
Law of Total Probabilities
Bayes Theorem
Discrete Probability Distribution
Binomial Distribution
Poisson Distribution
Relationship between Variables
Covariance and Correlation
Joint Probability Distribution
Sum of Random Variables
Correlation and Causation
Simpson’s Paradox
Continuous Probability Distributions
Uniform Distribution
Exponential Distribution
Normal Distribution
Standard Normal Distribution
Approximating Binomial with Normal
t-test
Hypothesis Testing
Type I and Type II Errors
Statistical Significance and Practical Significance
Hypothesis Testing Process
One-Tailed — Known Standard Deviation
Two-tailed — Known Standard Deviation
One-Tailed — Unknown Standard Deviation
Paired t-test
ANOVA
Chi-Square (χ2)
Regression
Simple Linear and Multiple Linear Regression
Least Squares Error Estimation
Overview
Sample Size
Choice of Variables
Assumptions
Normality
Linearity
Dummy Variables
Interaction Effects
Variable Selection Methods
Issues with Variables
Multicollinearity
Outliers and Influential Observations
Coefficient of Determination (R2)
Adjusted R2
F-ratio: Overall Model
t-test: Coefficients
Goodness-of-fit
Validation
Process
Factor Analysis
- Basic Statistics
- Sampling
- Marketing mix Modelling
Coronavirus — What the metrics do not reveal?
Coronavirus — Determining death rate
- Marketing Education
- Is Marketing Education Fluffy and Weak?
- How to Choose the Right Marketing Simulator
- Self-Learners: Experiential Learning to Adapt to the New Age of Marketing
- Negotiation Skills Training for Retailers, Marketers, Trade Marketers and Category Managers
- Simulators becoming essential Training Platforms
- What they SHOULD TEACH at Business Schools
- Experiential Learning through Marketing Simulators
-
MarketingMind
Basic Statistics
Basic Statistics
Probability Theory
Mutually Exclusive Events and Overlapping Events
Objective and Subjective Probabilities
Conditional (Posterior) Probability
Independent Events
Law of Total Probabilities
Bayes Theorem
Discrete Probability Distribution
Binomial Distribution
Poisson Distribution
Relationship between Variables
Covariance and Correlation
Joint Probability Distribution
Sum of Random Variables
Correlation and Causation
Simpson’s Paradox
Continuous Probability Distributions
Uniform Distribution
Exponential Distribution
Normal Distribution
Standard Normal Distribution
Approximating Binomial with Normal
t-test
Hypothesis Testing
Type I and Type II Errors
Statistical Significance and Practical Significance
Hypothesis Testing Process
One-Tailed — Known Standard Deviation
Two-tailed — Known Standard Deviation
One-Tailed — Unknown Standard Deviation
Paired t-test
ANOVA
Chi-Square (χ2)
Regression
Simple Linear and Multiple Linear Regression
Least Squares Error Estimation
Overview
Sample Size
Choice of Variables
Assumptions
Normality
Linearity
Dummy Variables
Interaction Effects
Variable Selection Methods
Issues with Variables
Multicollinearity
Outliers and Influential Observations
Coefficient of Determination (R2)
Adjusted R2
F-ratio: Overall Model
t-test: Coefficients
Goodness-of-fit
Validation
Process
Factor Analysis
- Basic Statistics
- Sampling
- Marketing mix Modelling
Coronavirus — What the metrics do not reveal?
Coronavirus — Determining death rate
- Marketing Education
- Is Marketing Education Fluffy and Weak?
- How to Choose the Right Marketing Simulator
- Self-Learners: Experiential Learning to Adapt to the New Age of Marketing
- Negotiation Skills Training for Retailers, Marketers, Trade Marketers and Category Managers
- Simulators becoming essential Training Platforms
- What they SHOULD TEACH at Business Schools
- Experiential Learning through Marketing Simulators
Normal Distribution
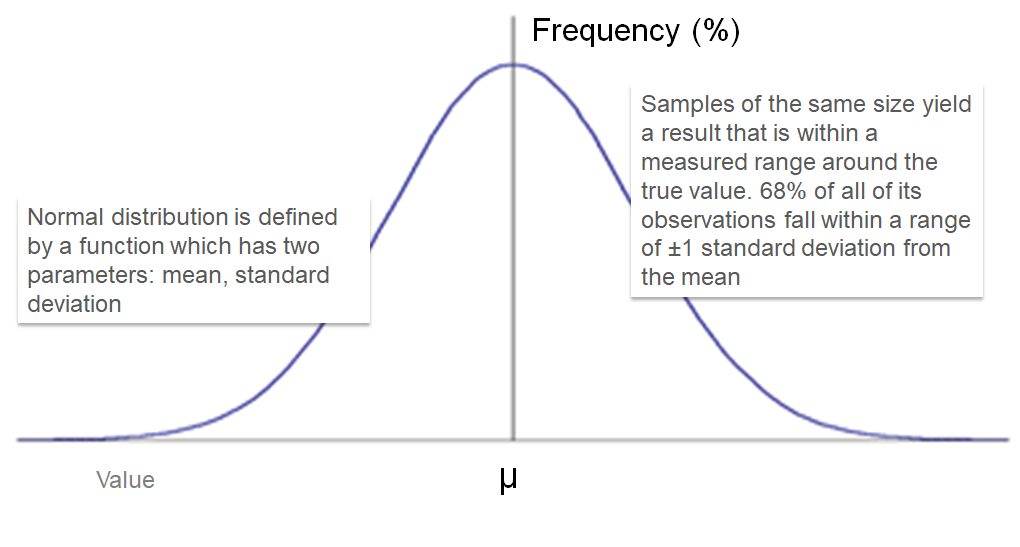
The normal distribution (Exhibit 34.17) is said to represent an elementary “truth about the general nature of reality”. It is a family of distributions, each defined by two parameters — mean (μ) and standard deviation (s).
The probability distribution function of a random variable X∼N(μ,σ) is:
$$f(x)=\frac{1}{\sqrt{2πσ^2}} e^{-\frac{(x-μ)^2}{2σ^2}}$$Standard Normal Distribution
The normal distribution X∼N(0,1), μ = 0 and σ = 1, is called the standard normal distribution, and its distribution function is:
$$f(x)=\frac{e^{-x^2/2}}{\sqrt{2π}}$$A value from any normal distribution can be transformed into its corresponding value on a standard normal distribution using the following formula:
$$Z =\frac{X - μ}{σ}$$where Z is the value on the standard normal distribution, X is the value on the original distribution, μ is the mean of the original distribution, and σ is the standard deviation of the original distribution.
$$E(Z)= E\biggl(\frac{X - μ}{σ}\biggr)=\frac{E(X) - μ}{σ}=0$$ $$Var(Z)=Var\biggl(\frac{X - μ}{σ}\biggr)=\frac{Var(X)}{σ^2}=1$$To computing probabilities for normal distributions, convert to standard value and lookup the distribution function tables for the standard normal distribution:
$$P(X≤b)→P\biggl(Z≤\frac{b - μ}{σ}\biggr)$$Note: The probabilities may also be obtained using the NORM.DIST function in Excel. The Excel NORM.INV function returns the variable value, given the parameters and the probability.
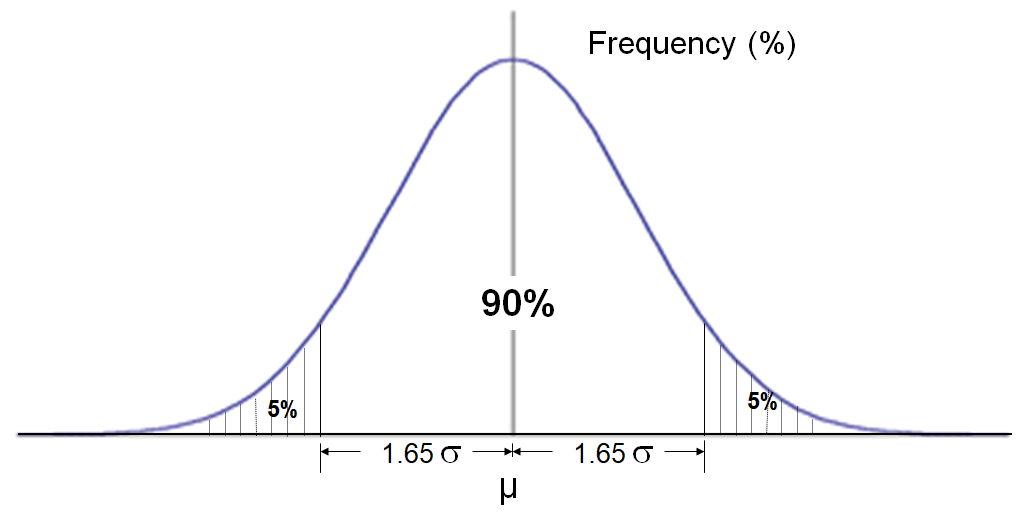
Exhibit 34.18 90% of the observations fall within a range of ±1.65 standard deviation from the mean.
If a random variable follows a normal distribution, we can expect that:
- 68% of the variable’s observations fall within a range of ±1 standard deviation from the mean.
- 90% of the observations fall within a range of ± 1.65 standard deviations from the mean, as depicted in Exhibit 34.18.
- 95% of observations lie within 1.96 standard deviations from the mean.
Approximating Binomial with Normal
According to the Central Limit Theorem, the normal distribution can be used as an approximation to the binomial distribution, if the sample size is large enough.
If X is Binomial (n, p):
$$E(X) = np$$ $$Var(V) = np(1-p)$$The approximate equivalent normal distribution is N[np,√(np(1-p))], provided np≥ 5 and n(1- p)≥ 5 (thumb rule).
Previous Next
Use the Search Bar to find content on MarketingMind.


Contact | Privacy Statement | Disclaimer: Opinions and views expressed on www.ashokcharan.com are the author’s personal views, and do not represent the official views of the National University of Singapore (NUS) or the NUS Business School | © Copyright 2013-2026 www.ashokcharan.com. All Rights Reserved.