
-
Basic Statistics
Basic Statistics
Probability Theory
Mutually Exclusive Events and Overlapping Events
Objective and Subjective Probabilities
Conditional (Posterior) Probability
Independent Events
Law of Total Probabilities
Bayes Theorem
Discrete Probability Distribution
Binomial Distribution
Poisson Distribution
Relationship between Variables
Covariance and Correlation
Joint Probability Distribution
Sum of Random Variables
Correlation and Causation
Simpson’s Paradox
Continuous Probability Distributions
Uniform Distribution
Exponential Distribution
Normal Distribution
Standard Normal Distribution
Approximating Binomial with Normal
t-test
Hypothesis Testing
Type I and Type II Errors
Statistical Significance and Practical Significance
Hypothesis Testing Process
One-Tailed — Known Standard Deviation
Two-tailed — Known Standard Deviation
One-Tailed — Unknown Standard Deviation
Paired t-test
ANOVA
Chi-Square (χ2)
Regression
Simple Linear and Multiple Linear Regression
Least Squares Error Estimation
Overview
Sample Size
Choice of Variables
Assumptions
Normality
Linearity
Dummy Variables
Interaction Effects
Variable Selection Methods
Issues with Variables
Multicollinearity
Outliers and Influential Observations
Coefficient of Determination (R2)
Adjusted R2
F-ratio: Overall Model
t-test: Coefficients
Goodness-of-fit
Validation
Process
Factor Analysis
- Basic Statistics
- Sampling
- Marketing mix Modelling
Coronavirus — What the metrics do not reveal?
Coronavirus — Determining death rate
- Marketing Education
- Is Marketing Education Fluffy and Weak?
- How to Choose the Right Marketing Simulator
- Self-Learners: Experiential Learning to Adapt to the New Age of Marketing
- Negotiation Skills Training for Retailers, Marketers, Trade Marketers and Category Managers
- Simulators becoming essential Training Platforms
- What they SHOULD TEACH at Business Schools
- Experiential Learning through Marketing Simulators
-
MarketingMind
Basic Statistics
Basic Statistics
Probability Theory
Mutually Exclusive Events and Overlapping Events
Objective and Subjective Probabilities
Conditional (Posterior) Probability
Independent Events
Law of Total Probabilities
Bayes Theorem
Discrete Probability Distribution
Binomial Distribution
Poisson Distribution
Relationship between Variables
Covariance and Correlation
Joint Probability Distribution
Sum of Random Variables
Correlation and Causation
Simpson’s Paradox
Continuous Probability Distributions
Uniform Distribution
Exponential Distribution
Normal Distribution
Standard Normal Distribution
Approximating Binomial with Normal
t-test
Hypothesis Testing
Type I and Type II Errors
Statistical Significance and Practical Significance
Hypothesis Testing Process
One-Tailed — Known Standard Deviation
Two-tailed — Known Standard Deviation
One-Tailed — Unknown Standard Deviation
Paired t-test
ANOVA
Chi-Square (χ2)
Regression
Simple Linear and Multiple Linear Regression
Least Squares Error Estimation
Overview
Sample Size
Choice of Variables
Assumptions
Normality
Linearity
Dummy Variables
Interaction Effects
Variable Selection Methods
Issues with Variables
Multicollinearity
Outliers and Influential Observations
Coefficient of Determination (R2)
Adjusted R2
F-ratio: Overall Model
t-test: Coefficients
Goodness-of-fit
Validation
Process
Factor Analysis
- Basic Statistics
- Sampling
- Marketing mix Modelling
Coronavirus — What the metrics do not reveal?
Coronavirus — Determining death rate
- Marketing Education
- Is Marketing Education Fluffy and Weak?
- How to Choose the Right Marketing Simulator
- Self-Learners: Experiential Learning to Adapt to the New Age of Marketing
- Negotiation Skills Training for Retailers, Marketers, Trade Marketers and Category Managers
- Simulators becoming essential Training Platforms
- What they SHOULD TEACH at Business Schools
- Experiential Learning through Marketing Simulators
Bayes Theorem
The Bayes’ theorem describes the probability of an event, based on prior knowledge of conditions that might be related to the event.
Posterior probability:
P(A│B) = P(A∩B)/P(B)
P(B│A) = P(A∩B)/P(A); i.e., P(A∩B) = P(B│A)×P(A)
P(A│B) = P(B│A)×P(A)/P(B)
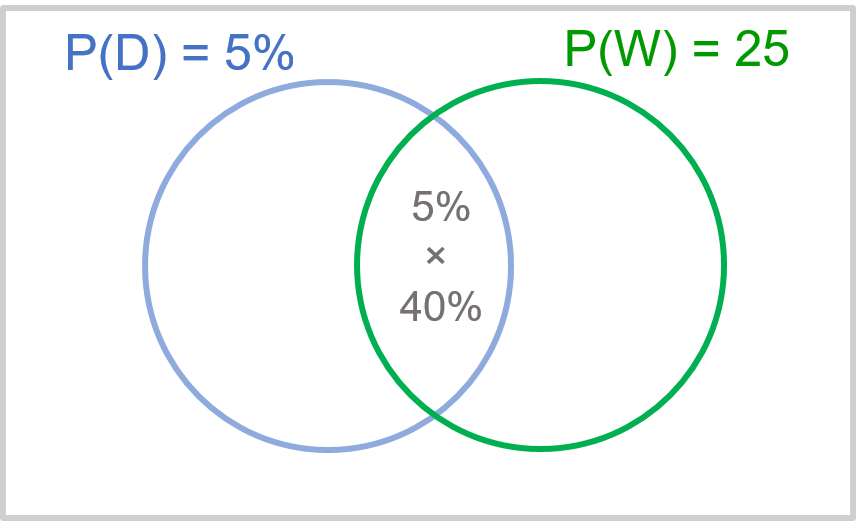
Example 1: A new body wash brand Daisy has been launched. The brand is targeting the users of Dove, another body wash brand. From research studies, it is known that 5% of the consumers in this market are Dove buyers, and that a high proportion, 40%, of them shop at Watsons, a personal care retail chain. It is also known that 25% of shoppers of personal care products shop at Watsons.
The brand manager is considering conducting a sampling programme for Daisy at Watson’s. However, it will only be viable to do so if at least 10% of Watson’s shoppers are Dove buyers. Should she go ahead with the programme?
The answer can be inferred from Exhibit 34.7, which sums up the information. With Bayes theorem:
$$P(D): Proportion \,of \,Dove \,buyers = 0.05$$ $$P(W): Proportion \,of \,Watsons \,shoppers = 0.25$$ $$P(W|D): Dove \,consumers \,who \,shop \,at \,Watsons = 0.40$$ $$P(D|W): Watsons \,shoppers \,who \,buy \,Dove$$ $$P(D│W)=\frac{P(W│D)×P(D)}{P(W)} =\frac{0.40×0.05}{0.25}=0.08=8 \text{%} $$Since the proportion of Dove buyers (8%) is less than 10%, it is not viable to conduct the proposed sampling exercise.
Example 2: A supermarket chain, Shop n Save (SnS), is facing stiff competition from market leader FairPrice (FP). The chain currently has a strong 32% base of regular shoppers but is concerned that a high proportion of these regular shoppers are also shopping at FairPrice.
Based on published research on FairPrice, the SnS team knows that 85% of supermarket shoppers shop regularly at FP, and 24% of these FP shoppers also shop regularly at SnS.
From this information, SnS team can compute the proportion of their regular shoppers who shop at FP:
$$P(S): \text{Proportion who shop regularly at SnS} = 0.32$$ $$P(F): \text{Proportion who shop regularly at FP} = 0.85$$ $$P(S|F): \text{Proportion of FP regular shoppers who shop regularly at SnS} = 0.24$$ $$P(F|S): \text{Proportion of SnS regular shoppers who shop regularly at FP}$$ $$P(F│S)=\frac{P(S│F)×P(F)}{P(S)}=\frac{0.24×0.85}{0.32}=64\text{%}$$
Exhibit 34.8 Bayes theorem, deriving posterior probabilities from prior probabilities and new information.
As depicted in Exhibit 34.8, , the approach begins with initial or prior probabilities for certain events. When additional information is obtained the revised or posterior probability are derived from the new information, using Bayes’ Theorem.
Consider n mutually exclusive and collectively exhaustive events, A1, A2 … An. Given that event B has occurred, we can use Bayes theorem to find the posterior probability:
$$P(A_i│B)=\frac{P(A_i∩B)}{P(B)}=\frac{P(B│A_i)×P(A_i)}{P(B)}$$ $$\qquad=\frac{P(B│A_i)×P(A_i)}{P(B│A_1)P(A_1)+P(B│A_2)P(A_2)… P(B|A_n)P(A_n)}$$Example 3: If the lung cancer test results for a patient are positive (T+), what is the probability, P(C+|T+), the patient has lung cancer (C+)?
Given:
- Prevalence rate: 1% of the target population (aged above 50 years) develops lung cancer (C = lung cancer). P(C+) = 0.01, P(C−) = 0.99.
- Sensitivity (=95%), denoted as P(T+│C+), is a statistical measure that indicates the ability of a diagnostic test to correctly identify individuals who have a particular condition or disease. The test shows positive result for 95% of patients with lung cancer.
- P(T+|C−)= 7.5%. The test shows positive result for 7.5% of patients who actually do not have lung cancer.
- Specificity = 1 − P(T+|C−) = P(T-|C−) = 1 – 7.5% = 92.5%. On 92.5% occasions the test correctly detected the absence of lung cancer given that the patient is not suffering from lung cancer.
NOTE: Laboratory tests reveal sensitivity and specificity. However, what the doctor needs to know is the likelihood that his patient is suffering from cancer, given that the test results are positive, i.e., the posterior probability, P(C+|T+).

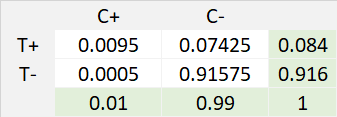
Exhibit 34.9 Example 3 — Prevalence rate for cancer (1%), cancer test sensitivity (95%) and cancer test specificity (92.5%).
The table in Exhibit 34.9 presents the probabilities derived as follows, from the information given above: $$P(T+ ∩ \,C+) = P(T+|\,C+) × P(C+) = 0.95 × 0.01 = 0.0095$$ $$P(T+ ∩ \,C-) = P(T+|\,C-) × P(C-) = 0.075 × 0.99 = 0.07425$$
Question: P(C+|T+): If the cancer test results for a patient are positive (T+), what is the probability the patient has cancer (C+)?
$$P(C+│T+)=\frac{P(T+ ∩ \,C+)}{P(T+)} = 0.0095/0.084 = 0.11$$There is 11% probability that patient has lung cancer, given the test turns out to be positive. By applying the Bayes’ Theorem, we are able to transform the probabilities from lab test or research study, into probabilities that are useful.
In this example, if you undergo the cancer test and receive a positive result, it can be understandably terrifying to learn that 95 percent of patients with cancer also receive the same positive result. However, it is important to consider that the probability of actually having cancer is 11%, which, although still concerning, provides a slightly less alarming perspective. This information is not only more useful but also more relevant in assessing your situation accurately.
Posterior Odds
By rules of conditional probability:
$$P(C+│\,T+)=\frac{P(T+ ∩\, C+)}{P(T+)} = \frac{P(T+│\,C+)×P(C+)}{P(T+)}$$ $$Posterior = Likelihood × \frac{Prior}{P(T+)}$$ $$\mathbf{Posterior ∝ Likelihood × Prior}$$Likelihood is based on past data — in this case the likelihood the test is positive given that the patient has cancer.
Prior represents additional knowledge — 1% of the target population has cancer. Prior could be a hunch, or it could be data taken from another study, i.e., anything that has a bearing on the calculation.
Posterior is the information we are interested in. The probability that patient has lung cancer, given the test turns out to be positive.
$$P(C+│\,T+)=\frac{P(T+ ∩\, C+)}{P(T+)} = \frac{P(T+│\,C+)×P(C+)}{P(T+)}$$ $$P(C−│\,T+)=\frac{P(T+ ∩\, C−)}{P(T+)} = \frac{P(T+│\,C−)×P(C−)}{P(T+)}$$Taking ratios:
$$\frac{P(C+│\,T+)}{P(C−│\,T+)}=\frac{P(T+│\,C+)}{P(T+│\,C−)}×\frac{P(C+)}{P(C−)}$$ $$\mathbf{Posterior \,odds = likelihood \,ratio × prior \,odds}$$Example 4: A leading pharmaceutical firm segmented its customers, based on their priorities and preference. The segmentation process may be summed up in 3 steps:
- Qualitative study (Focus Groups) to understand priorities and preferences.
- Quantitative study to measure customers’ preferences and priorities.
- Cluster analysis to identify and name the segments.
The company identified 3 segments:
- Quality seekers: Oriented towards clinical quality, less sensitive to cost of services.
- Cost conscious customers: Priority on reducing their expenses.
- Empowered health seekers: Choose to have greater control of their health options.
The firm is particularly interested in quality seeking customers and wants to tailor services for this segment.
To identify these customers, a 5-minute, screening questionnaire was developed.
Based on statistics from the quantitative study and the cluster analysis, the probability that the screening test would correctly identify a quality seeker, P(T+/ Q+), is 90%. But 8% of customers who were not quality seekers would also test positive, P(T+/Q-) = 8%. The cluster analysis also revealed that 20% of the firm’s customer are likely to be quality seekers, P(Q+) = 20%.
Based on this information, we can tell what proportion of customers who are screened as quality seekers, are actually quality seekers?
$$P(T+)= P(T+ ∩\, Q+)+P(T+ ∩\, Q-) $$ $$P(T+ ∩\, Q+) = P(T+│\,Q+) × P(Q+) = 0.90 × 0.20 = 0.18$$ $$P(T+ ∩\, Q-) = P(T+│\,Q-) × P(Q-) = 0.08 × 0.80 = 0.064$$ $$P(T+)=0.18+ 0.064=0.244$$ $$P(Q+│\,T+)=\frac{P(T+ ∩\, Q+)}{P(T+)} = \frac{P(T+│\,Q+)×P(Q+)}{P(T+)} = \frac{0.90 ×0.20}{0.244}=73.8 \% $$73.8% of customers that are screened positive, will actually be a quality seeker.
Previous Next
Use the Search Bar to find content on MarketingMind.


Contact | Privacy Statement | Disclaimer: Opinions and views expressed on www.ashokcharan.com are the author’s personal views, and do not represent the official views of the National University of Singapore (NUS) or the NUS Business School | © Copyright 2013-2026 www.ashokcharan.com. All Rights Reserved.