
Promotion Evaluation
Baseline Analysis of Promotions
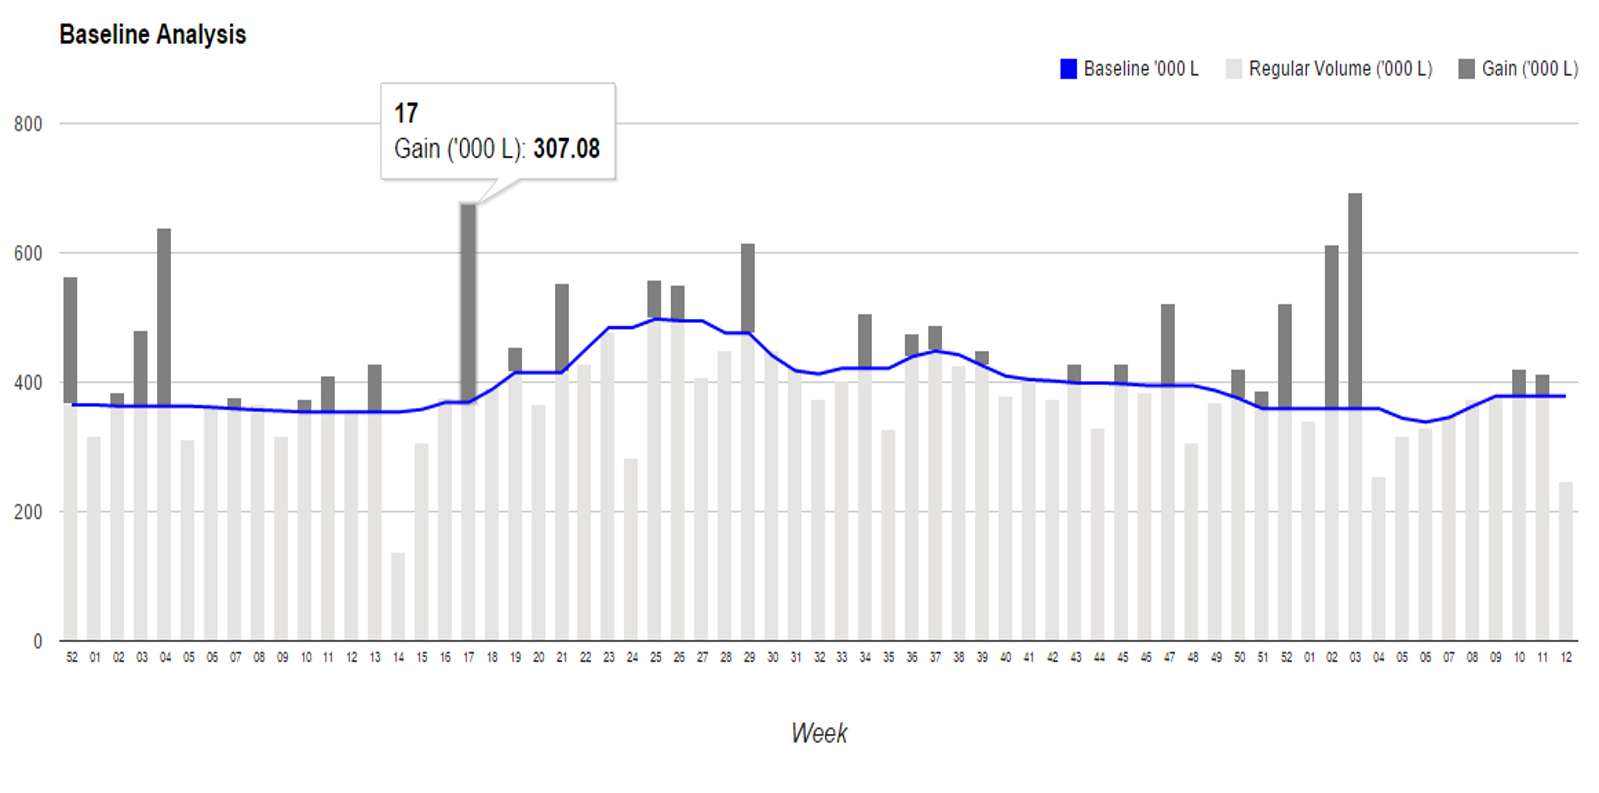
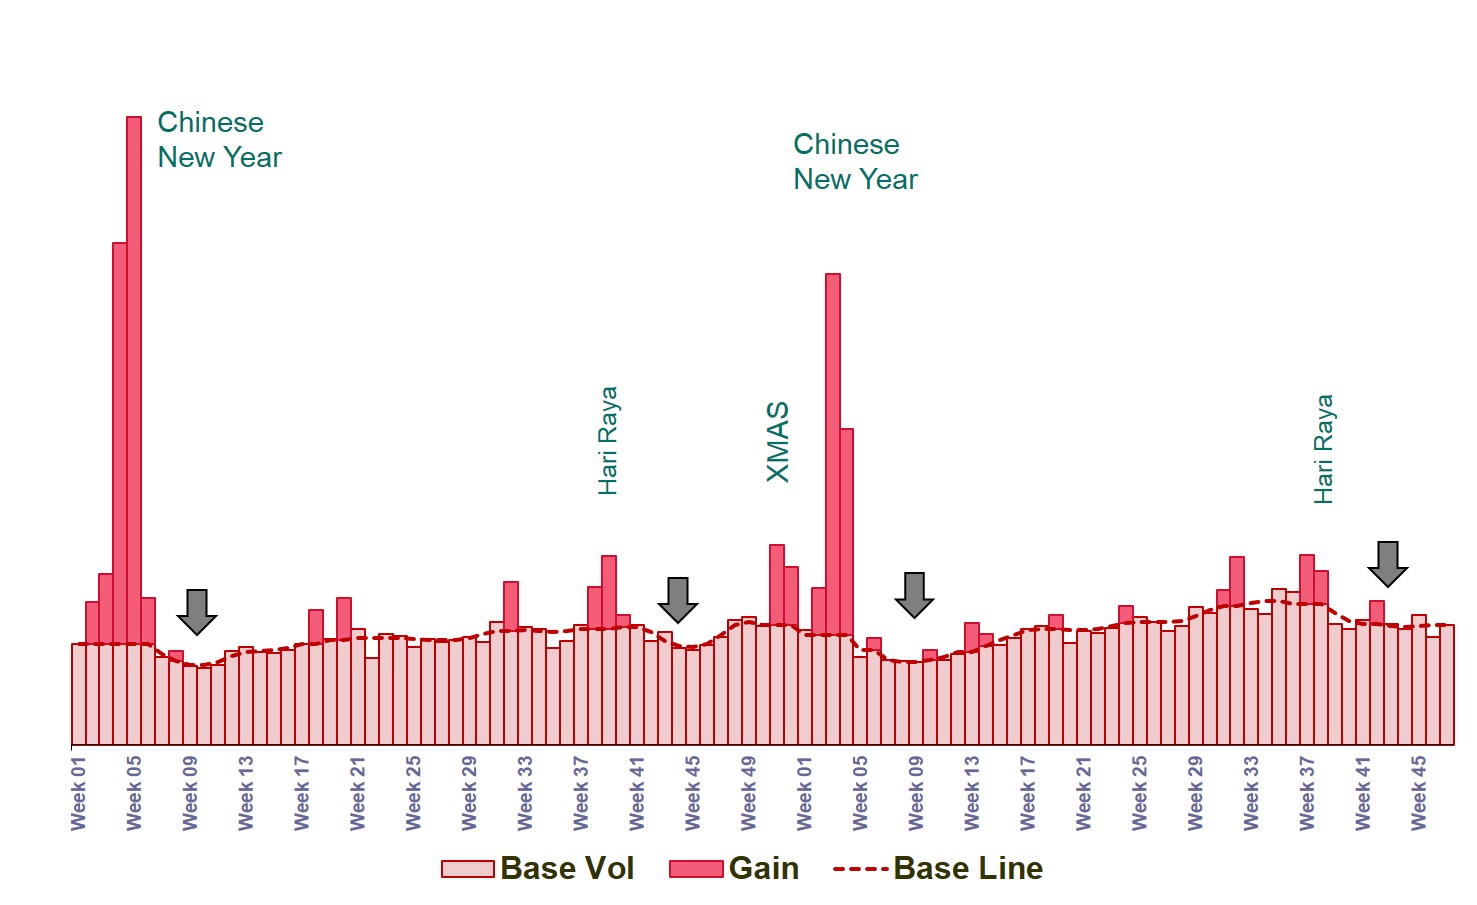
A simple approach to analysing promotions is to assess their impact in terms of volume, value and profitability. This is achieved by means of estimating the base volume, i.e., the expected sales volume in the absence of short-term causal influences such as promotions. The result is depicted by means of a baseline dashboard such as the one shown here, which utilizes a proprietary algorithm for estimating base volume. As can be seen from the dashboards, promotions and other causal influences, plotted alongside baseline and sales data, reveal the impact of these causal factors on sales.
Promotions can vary considerably in terms of impact. Some of them seem to work better than others; some items respond better to promotional influences; some promotions generate big gains, whereas others cannibalize; some promotions are profitable, others incur loss.
It is important, however, to appreciate that the impact of a promotion should not be gauged solely on the performance of an item, or a brand or even a category. Taking a blinkered view can be misleading both for the manufacturer as well as the retailer.
Consider for instance that an effective loss leader is unprofitable when view in isolation, and yet it may be highly profitable when assessed in terms of the retailers total business. For the retailer, promotions must be understood in the context of category roles and strategies, and in many instances you need to evaluate their overall impact through retail analytics and consumer analytics.
Baseline analysis is very useful because it quickly and inexpensively provides information on a large number of brands, in a manner that a layman is able to understand. It does not however, answer a number of critical questions, including the ones listed below:
- What elements of the promotion are more effective in driving sales? What is the impact of the discount, the display, and the cooperative advertisement?
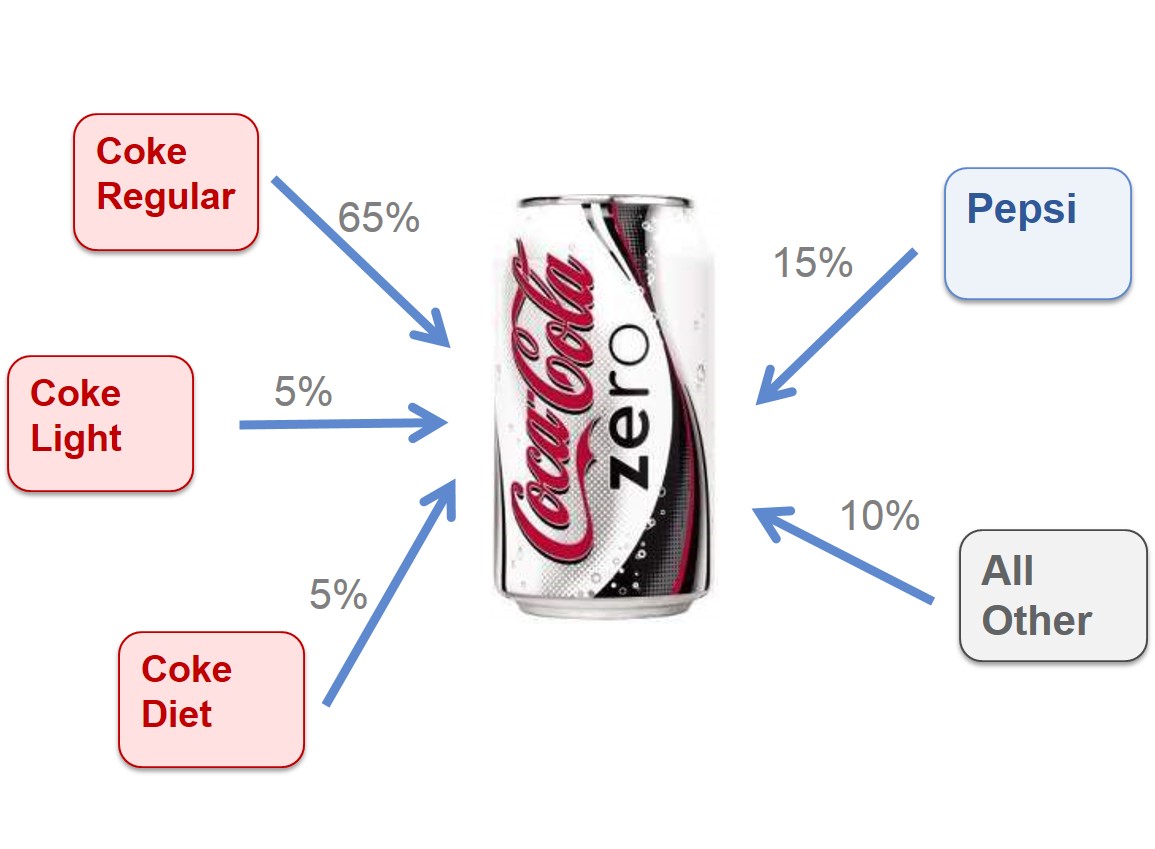
- Does the promotion cannibalize manufacturer’s own brands? Or does it “steal” share from competitor’s brands?
- To what extent does the promotion help build category volume?
- How much more volume could be gained if the discounts are further increased?
- What is the optimum promo mix that maximizes sales volume without incurring any loss in profit?
Econometric response modelling of promotions
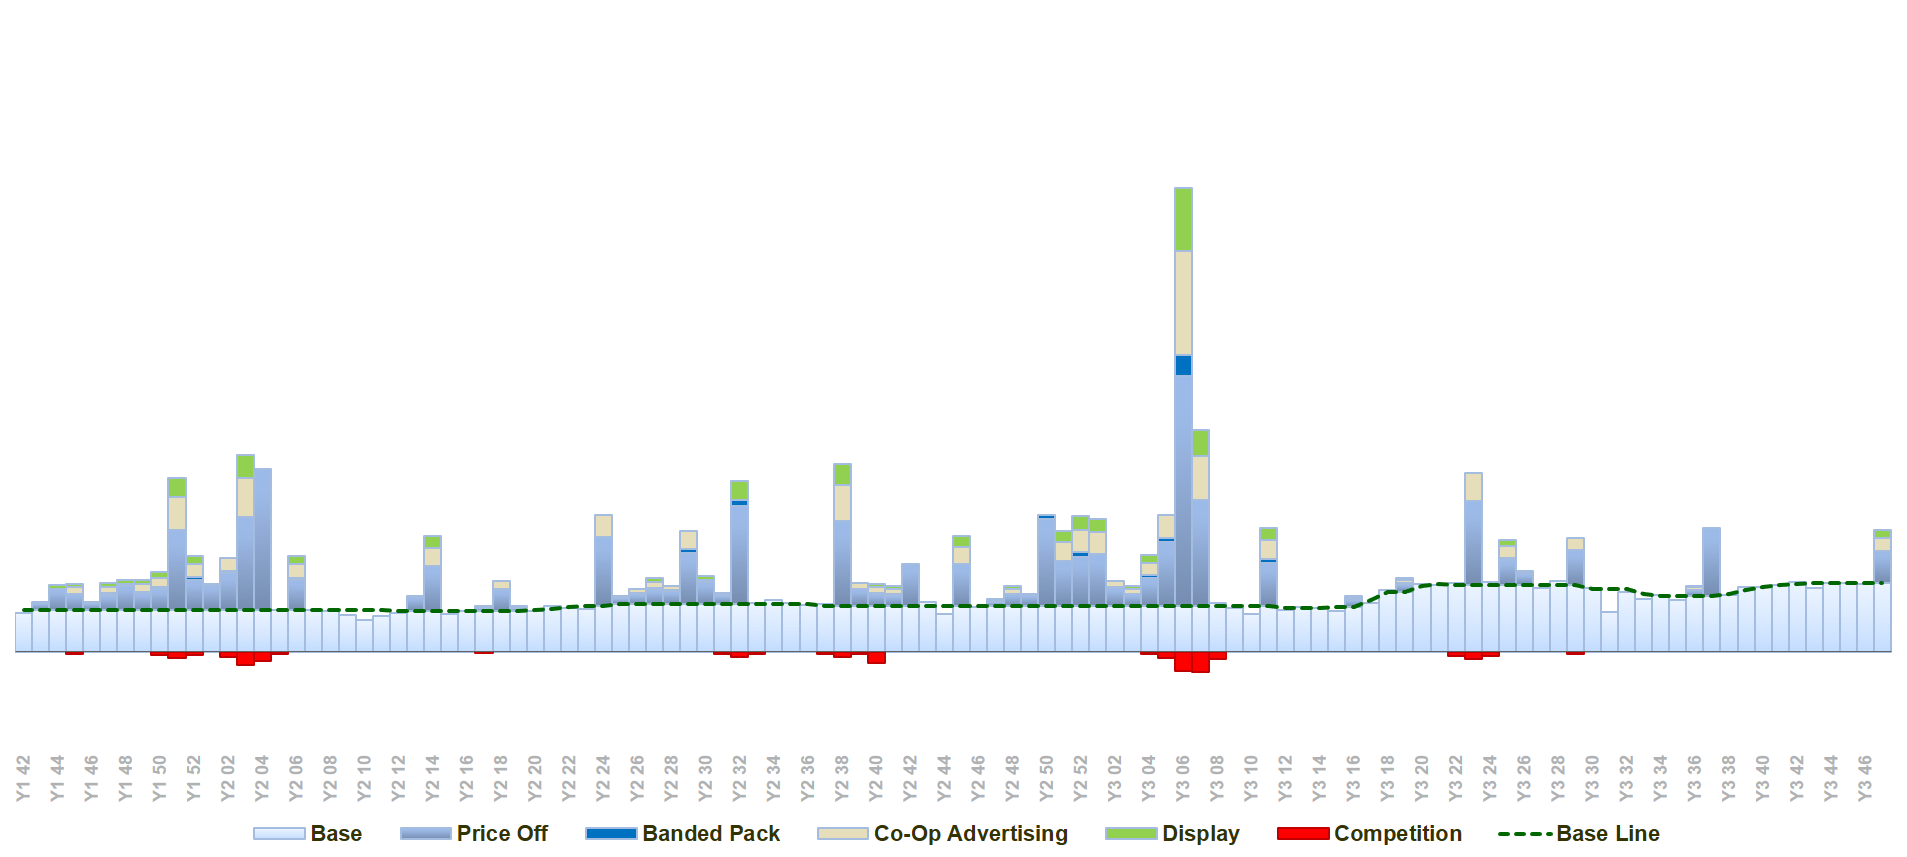
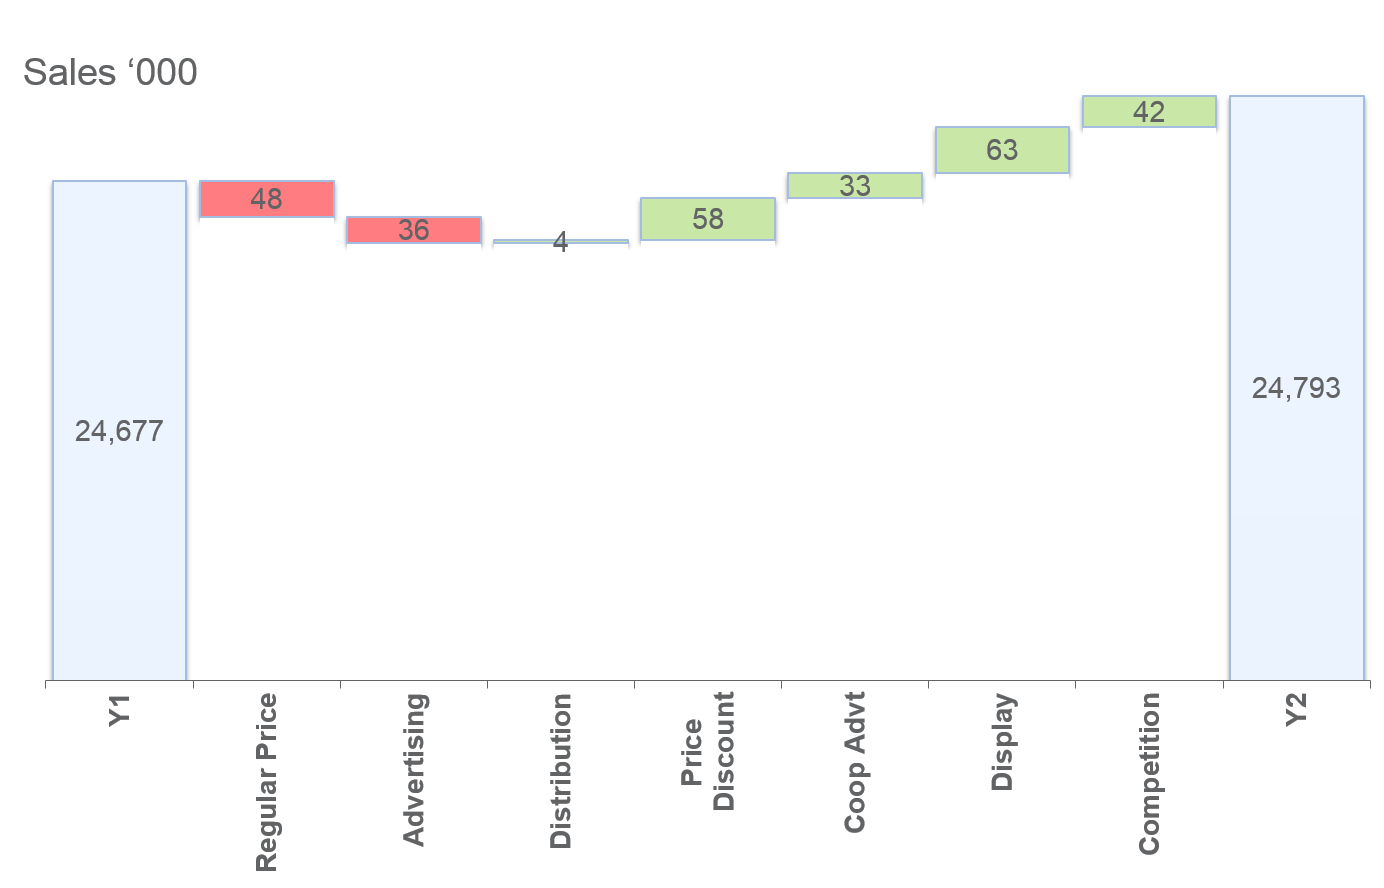
Econometric response modelling of promotions can provide answers to all of the questions posed above. These models analyse data to establish the impact of each individual element of a promotion on sales. The sales response functions derived from these models yield estimates of discount elasticity of demand, discount cross elasticity of demand, and sales lifts due to displays, co-op advertising and other causal factors. It is possible to decompose sales into all of the elements contributing to the volume. Promotion response models can also forecast what impact a possible combination of initiatives will have on sales.
Promotions — Plans, Strategies and Tactics
For retailers, promotions plans and strategies need to be aligned with the category’s roles and strategies.
Take for instance breakfast cereals. The category’s role varies across markets, across channels and across chains. In mature markets like North America or Europe, breakfast cereals might be a destination category. On the other hand, in Asian markets where the penetration of breakfast cereals is relatively low, the category is more likely to be a routine category.
One approach to understanding how to create effective promotion plans is to consider different scenarios. For instance:
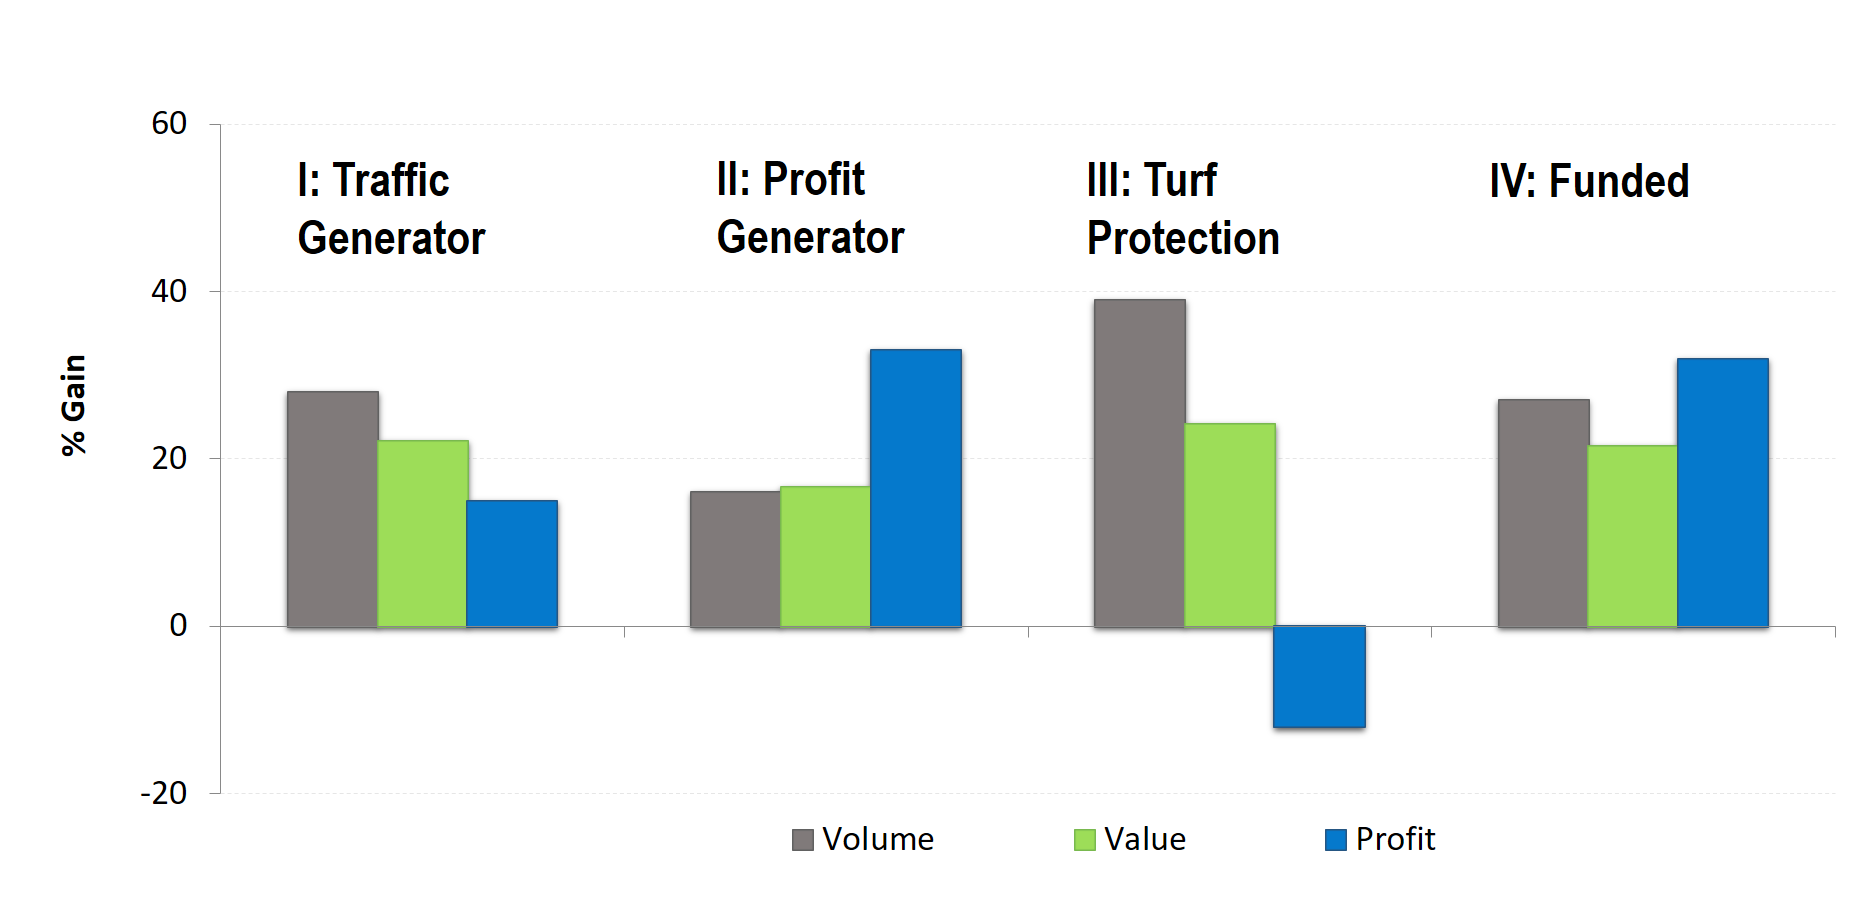
- Scenario I: The category is traffic generator for the retail chain. The objective is to achieve large gains in sales volume, while maintaining profits.
- Scenario II: The category is a routine category that plays the strategic role of generating profits.
- Scenario III: In response to the entry of a major global competitor, the aim of the promotions plan is to generate excitement in the stores and minimize defections due the competitor’s marketing efforts and in-store activities, even if it results in significant losses.
- Scenario IV: Promotional support offered by manufacturers is factored into this promotions plan.
A summary of the scenario outcome from the Profit Analysis reports is provided in the above exhibit. The analysis is sourced from the Plannogrammer an online training facility for category managers, trade marketers, and retailers in consumer markets.
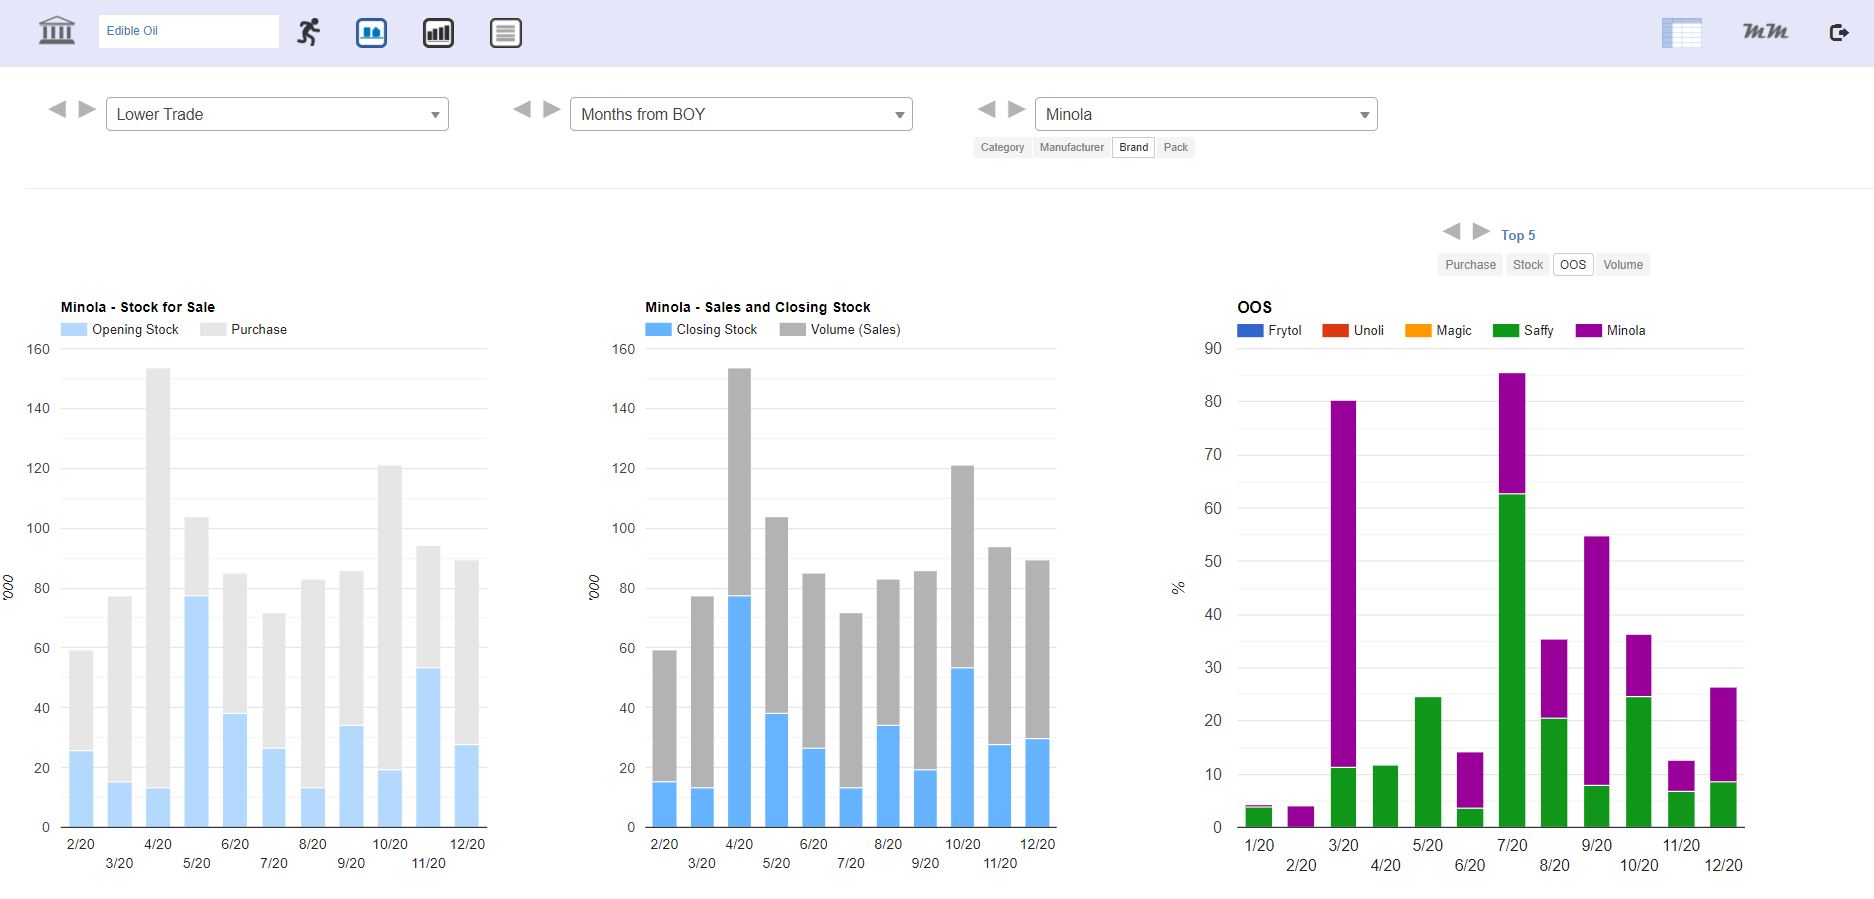
Plannogrammer supports a collection of simulation and analysis platforms such as Promotions and Space Planner for optimizing space and promotion plans, Plannogram for populating shelves and merchandising, a Due To Analysis dashboard that decomposes brand sales into the factors driving sales, and a Promotion Evaluator to evaluate the volume, value and profit impact of promotion plans.
Reverting to the profit analysis, Scenario III, an extreme example of turf protection, yields the maximum gains in volume, but at the expense of profits. A key point to note is the assumption that the model parameters do not change despite the entrance of a competing retail chain. While the new entrant will certainly affect market dynamics, the current information on elasticities and cross-elasticities is the only estimate we can work with.
While Scenario II is the most profitable, Scenario IV, which relies of promotional support from manufacturers, provides the best outcome in overall terms.
Importantly take note that the profit analysis does not account for the gains in sales and profits of other product categories, through the additional store traffic generated by the category on promotion. The retail chain would benefit from any increase in shopper traffic yielding gains in sales and profits across product categories over and above the gain/loss in the promoted category.
Contact
Ashok Charan,
Marketing Analytics Practitioner’s Guide,
Digital Marketing,
Marketing Mind,
Destiny Marketing Simulator,
 ashok.charan@gmail.com


