Scan Track and Retail Analytics
Manufacturers have access to large quantities of retail sales data from research agencies as well as directly from retailers. This data yields metrics for market share, sales and distribution that are fundamental to formulating marketing strategies and sales plans. To better utilize this information they need to organize and manage the data so that it is easy to read and analyse.
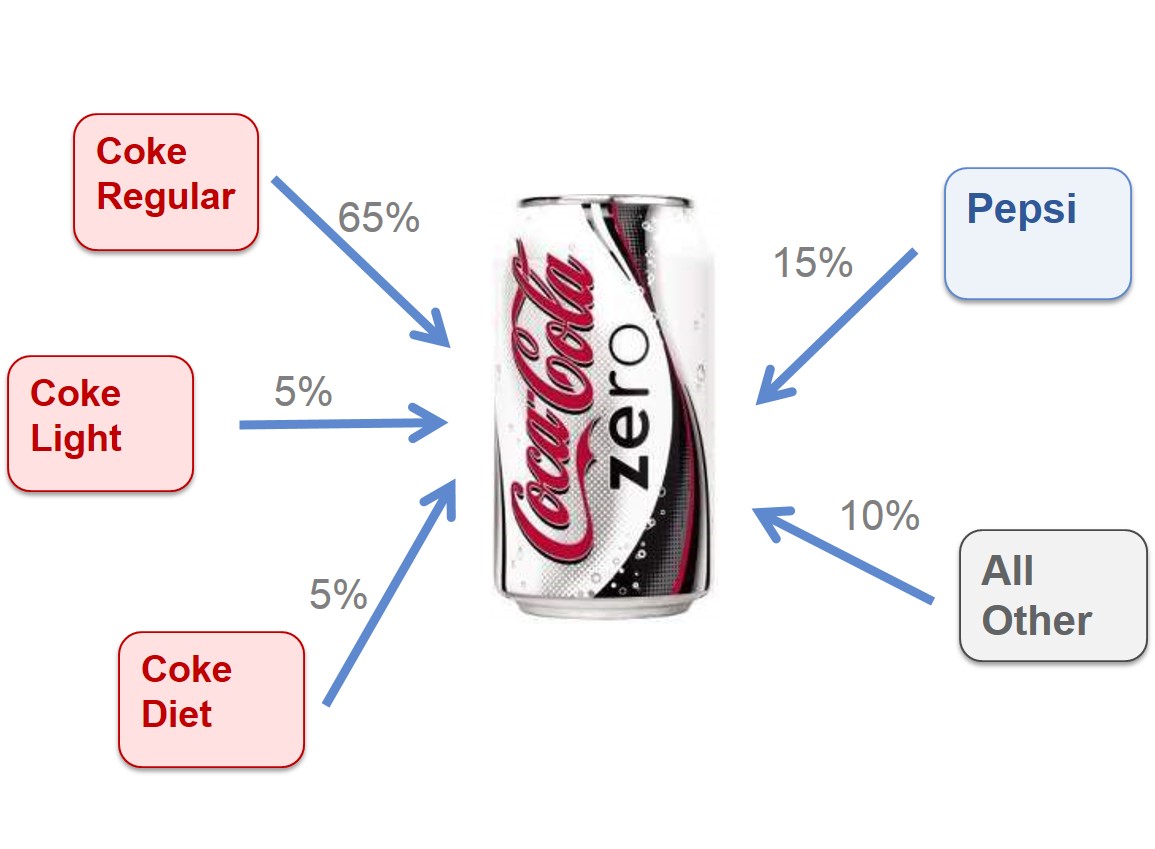
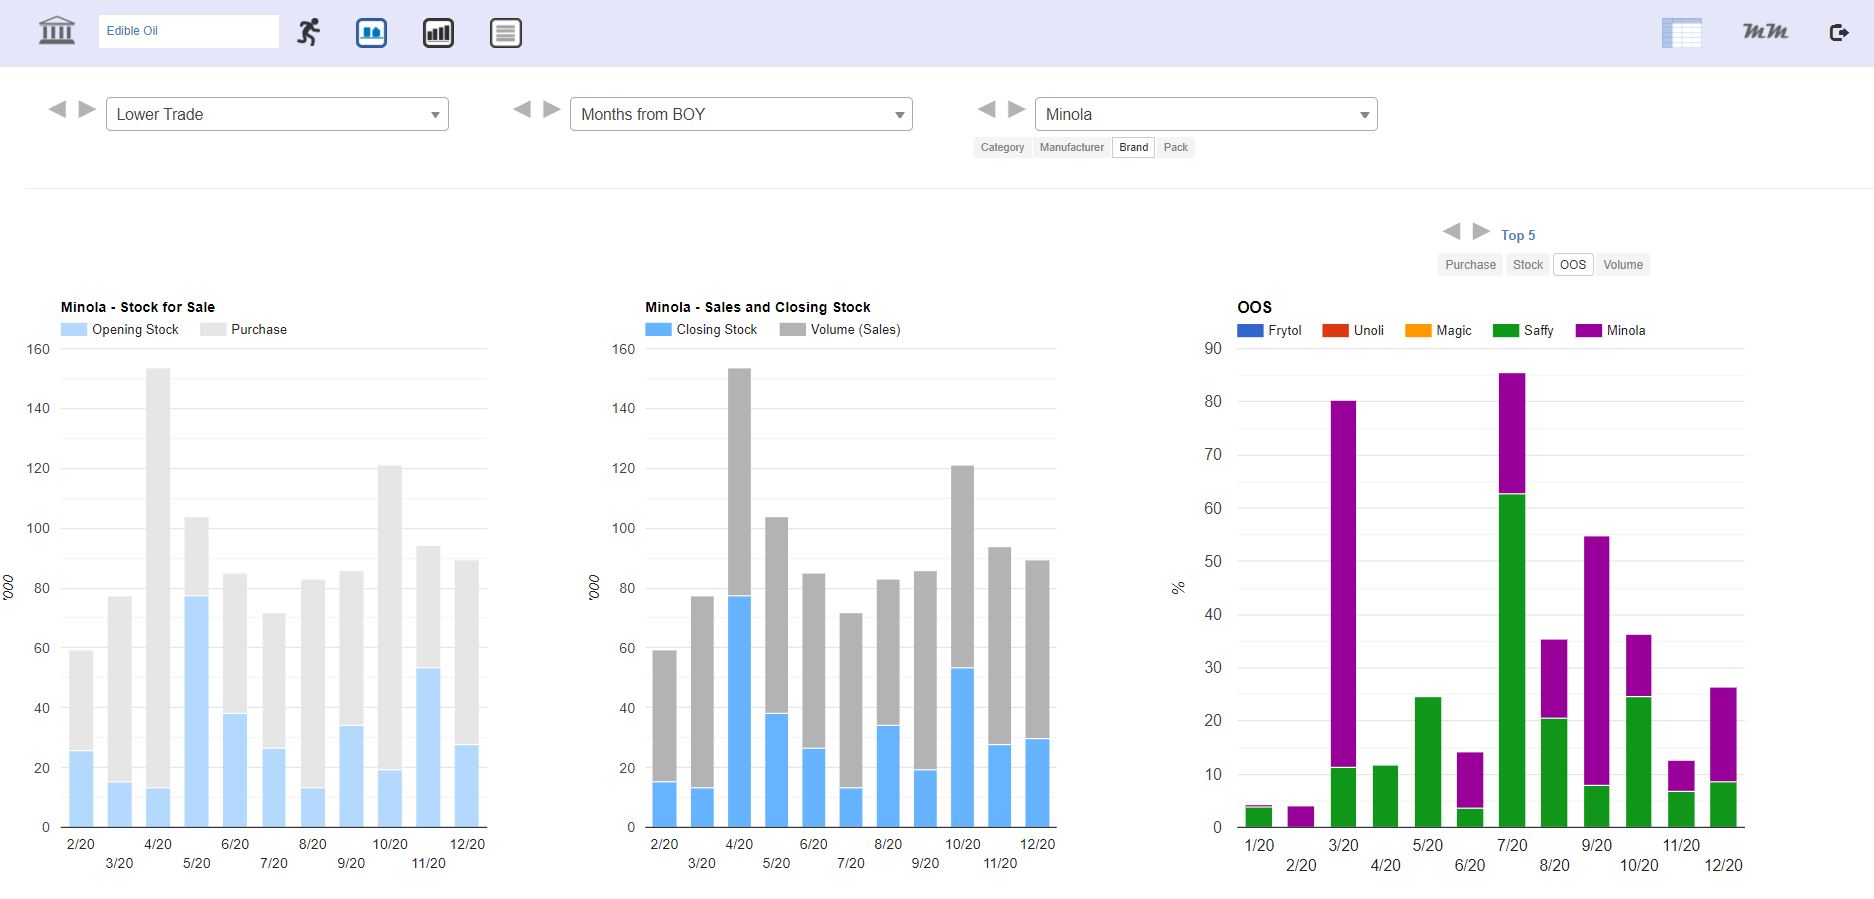
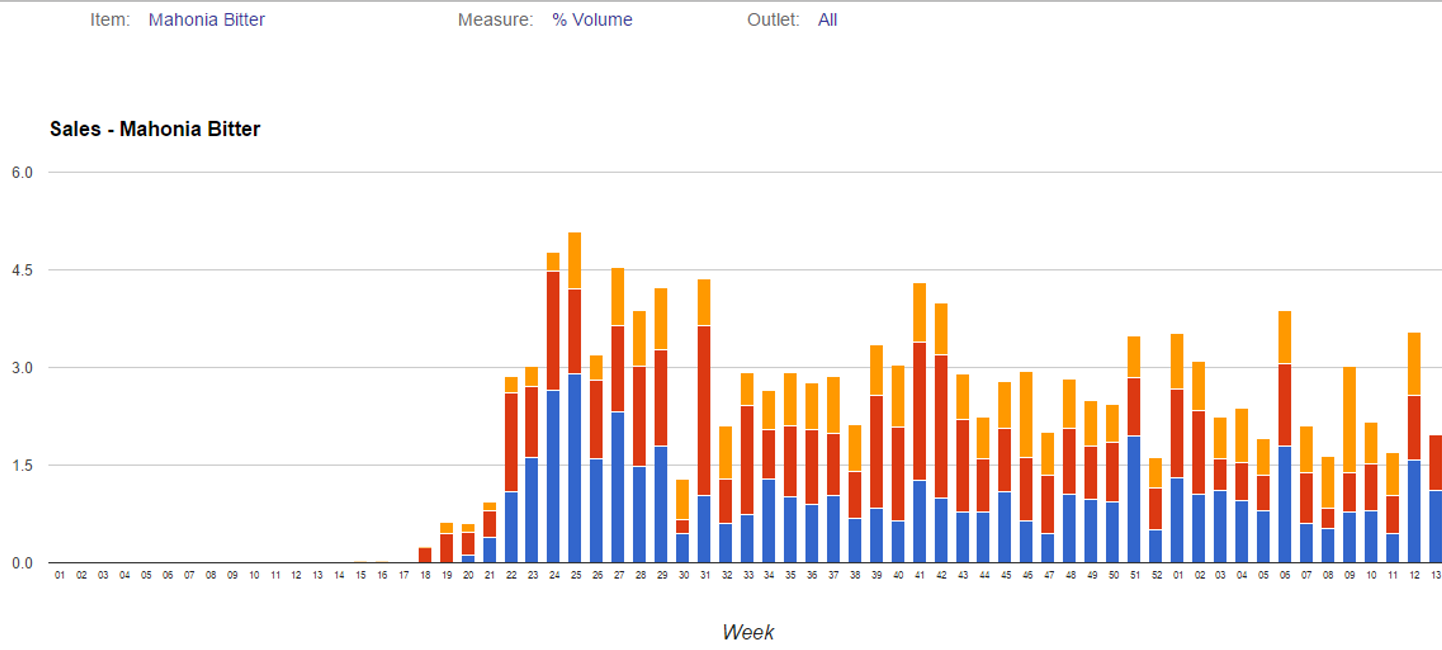
The dashboards shown here illustrate a custom designed, interactive, online scan track solution for soft drinks, where the data is disguised.
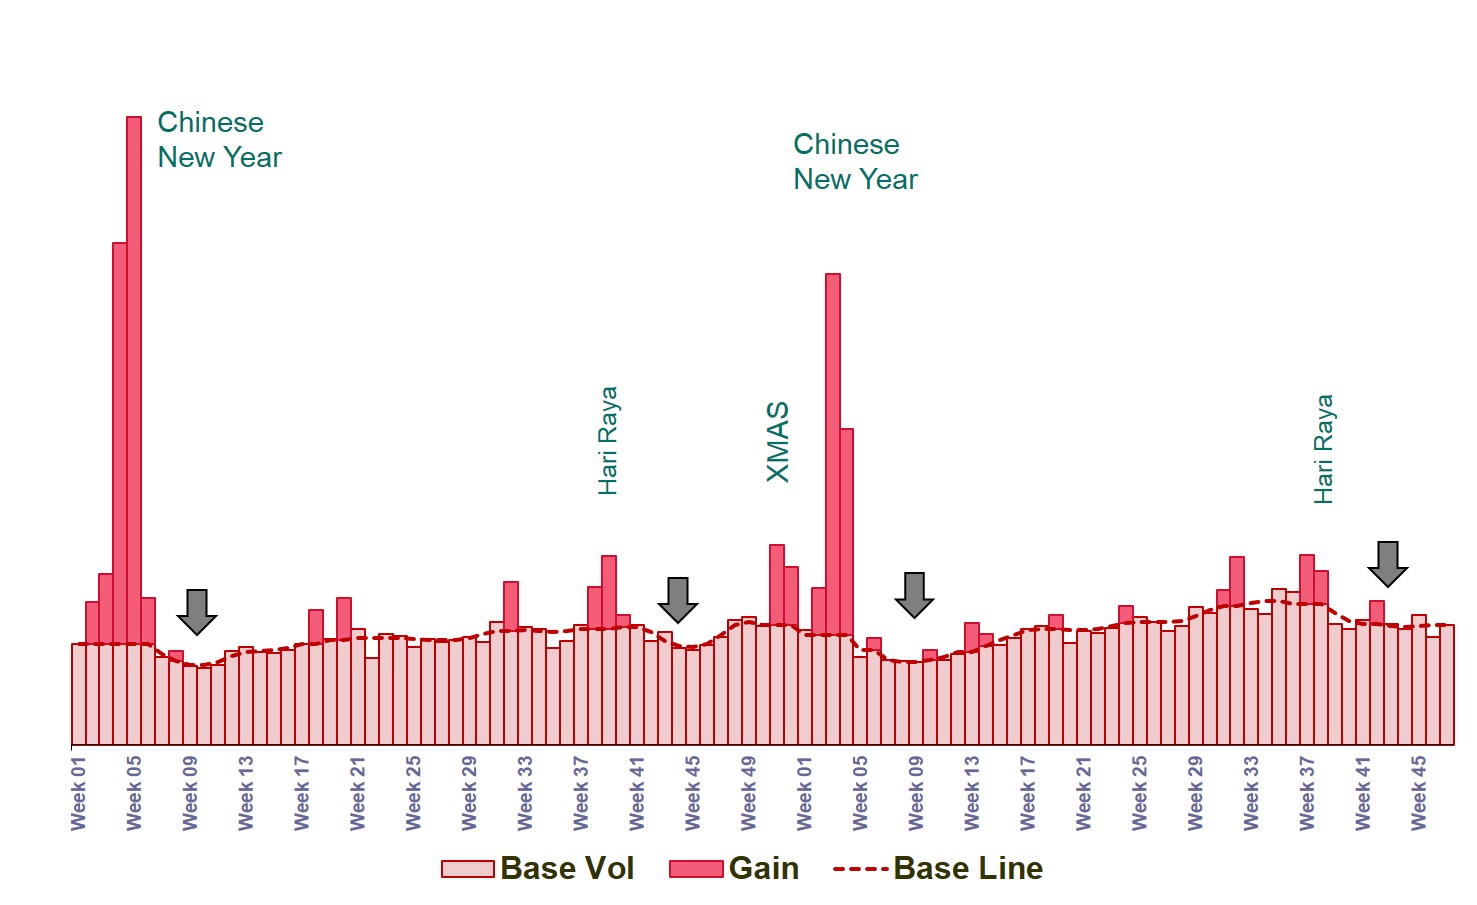
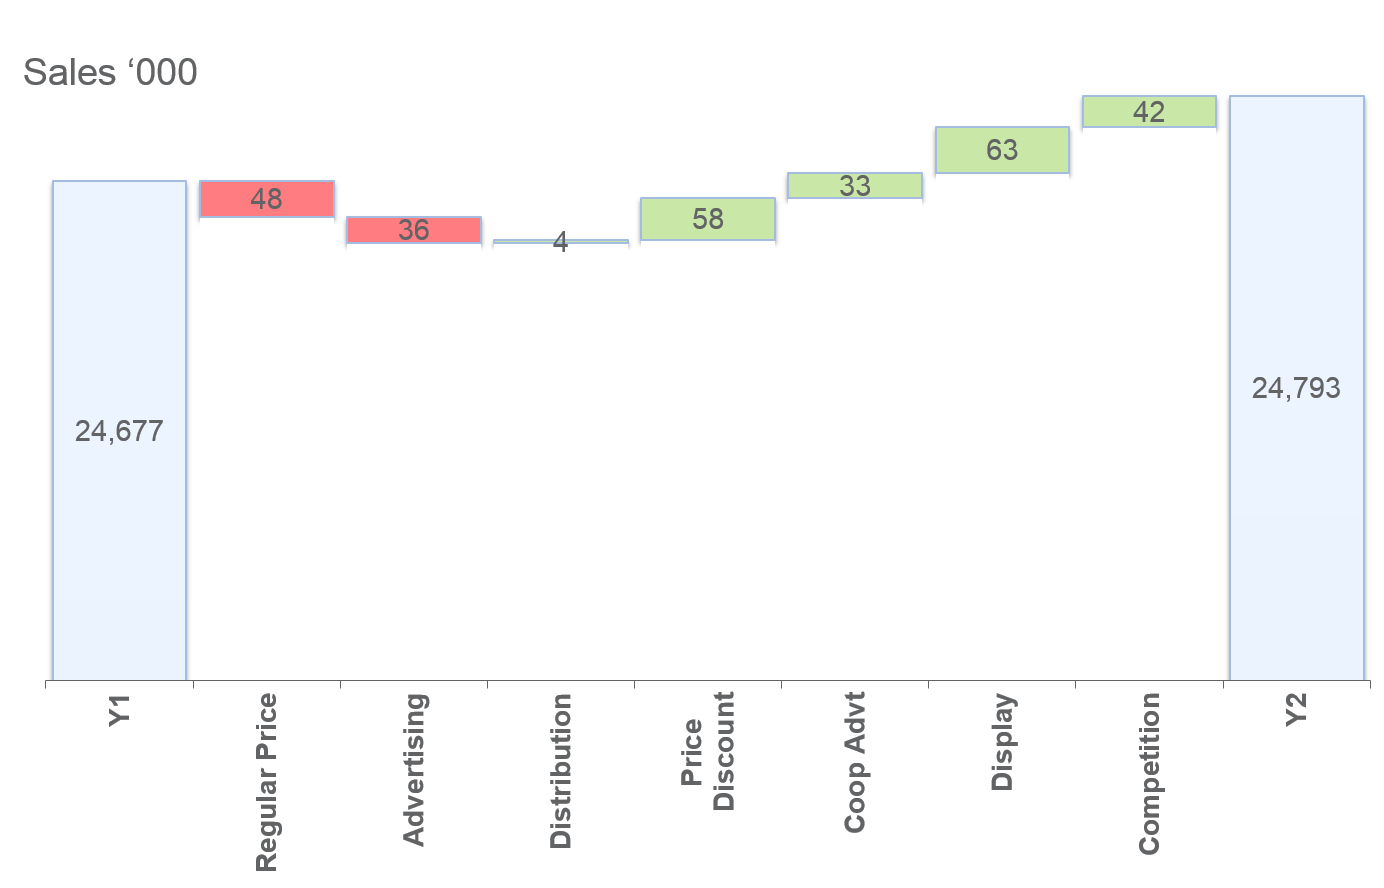
In addition to a scan track report, the suite includes a baseline dashboard. This utilizes a proprietary algorithm for estimating base volume (i.e., the expected sales volume in the absence of short term causal influences such as promotions) so that sales and marketing managers can gain a basic understanding of the impact of the various causal factors that affect sales. When information on promotions and other causal influences is plotted alongside the baseline and sales data, you get to see the impact of the causal factors on sales.
Retail analytics is the analysis of continuous outlet level transaction and shopper data to address business issues. Typically transaction data from sources such as scan track and retail audits, is filtered to form outlet groups. For instance a retailer or a supplier might be interested in examining outlets that stocked a particular brand compared with outlets that did not stock that brand. Or outlets that offered a promotion versus outlets that did not do so. Retail analytic techniques encompass a wide array of outlet group analysis addressing aspects such as brand handlers’ analysis, brand overlap, assortment, shelf space, pricing, promotion and rate of sales.
Customer transaction databases (e.g. sales transaction data, consumer panel data, loyalty panel data) also feed into retail analytics. These databases have the customer dimension in addition to outlet dimension, thus adding an additional layer of diagnostic capabilities. This data can be used to compute chain or outlet penetration, spend per customer, chain loyalty, cannibalization among outlets and so on, using the similar concepts, tools and techniques that are applicable for consumer analytics. In addition retail analytics encompasses constructs such as chain propensity and loyalty, and assortment optimization techniques.
These analytic techniques are covered in the chapters Retail Analytics and Sales and Distribution of the Marketing Analytics eGuide. The key processes — universe definition, retail census, sample design and recruitment, data collection, data processing, analysis and interpretation — that make-up a retail tracking service are covered in the chapter Retail Tracking. The chapter also explains the metrics supported by the service, relates the benefits and applications of the service, and illustrates how the data is interpreted. The eGuide also has a number of case studies that facilitate a deeper understanding of distribution and sales data, and the application of retail analytics.
Contact
Ashok Charan,
Marketing Analytics Practitioner’s Guide,
Digital Marketing,
Marketing Mind,
Destiny Marketing Simulator,
 ashok.charan@gmail.com


