
Consumer Analytics, Loyalty Analytics
Click on any of the following links for demonstrations of the diverse range of analyses that fall under consumer analytics:
- % Buyers
- Consumption: Volume per buyer
- Demographic profile
- Loyalty profile
- Solus/core/non-core
- Basket
- Cross basket analysis
- Gain-loss
- Trial
- Purchase Frequency
- Repeat decay
- Overlap analysis
- Forecasting: Market Share = Trial × RBR × Buying Index
Consumer analytics is a dynamic and insightful branch of marketing science. It focuses on analysing continuous, individual or household-level (customer-level) behavioural data to uncover valuable insights that help businesses identify and address key challenges.
This data can be sourced from online and offline consumer transactions, interactions, or managed sources such as consumer and loyalty panels.
Structured data sources are particularly useful for diagnosing purchasing behaviour in markets where repeat buying is common. A wide range of analytical metrics and techniques—including purchase frequency, buyer segmentation, behavioural brand loyalty, trial and repeat purchase analysis, overlap analysis, basket analysis, gain-loss analysis, and new product sales forecasting—help businesses understand and predict consumer behaviour.
These insights are derived using analytical algorithms that filter and drill into data, revealing patterns and trends that shape buying behaviour.


DBS Black - Launch Evaluation
A fictitious case example assessing the launch of the DBS Black Card using transaction data.
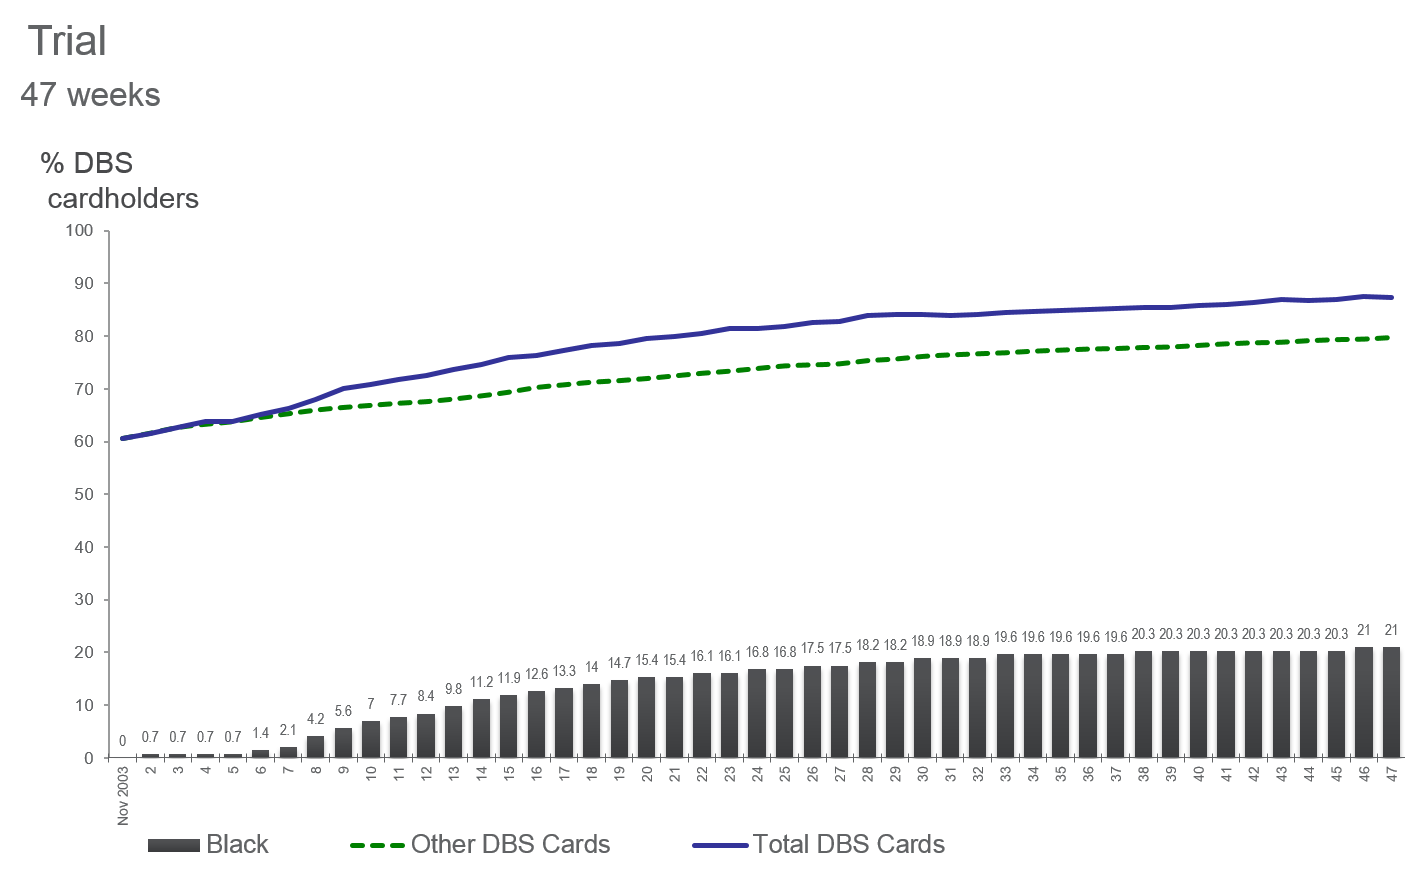
Penetration
DBS Black achieves a 21% trial rate in its first year. This is a reflection of the new card’s success at its first moment of truth. An important measure for success, the trial rate must be viewed in conjunction with repeat usage rate and usage index to accurately forecast the contribution of the new card.
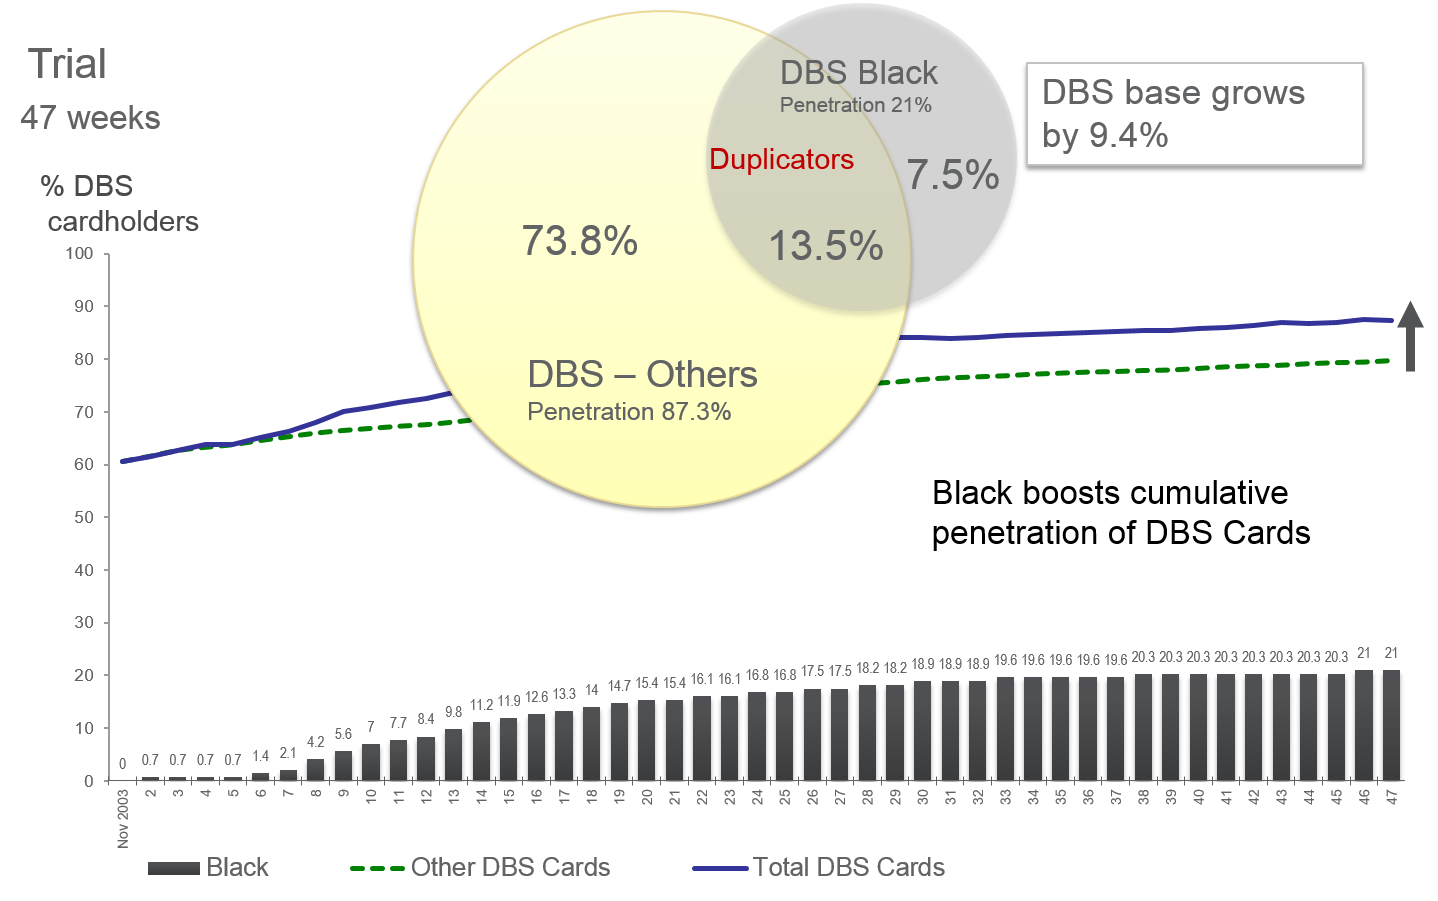
Overlap
The new card boosts the penetration of DBS Cards. 13.5% of the new card’s users are duplicators, i.e., they also use other DBS cards. The remaining 7.5% are new DBS card customers.
Repeat Usage Rate
Repeat Usage Rate, the second moment of truth, measures the propensity of trialists to continue using the card. It is the parameter that usually has the greatest bearing on the success of the new product.
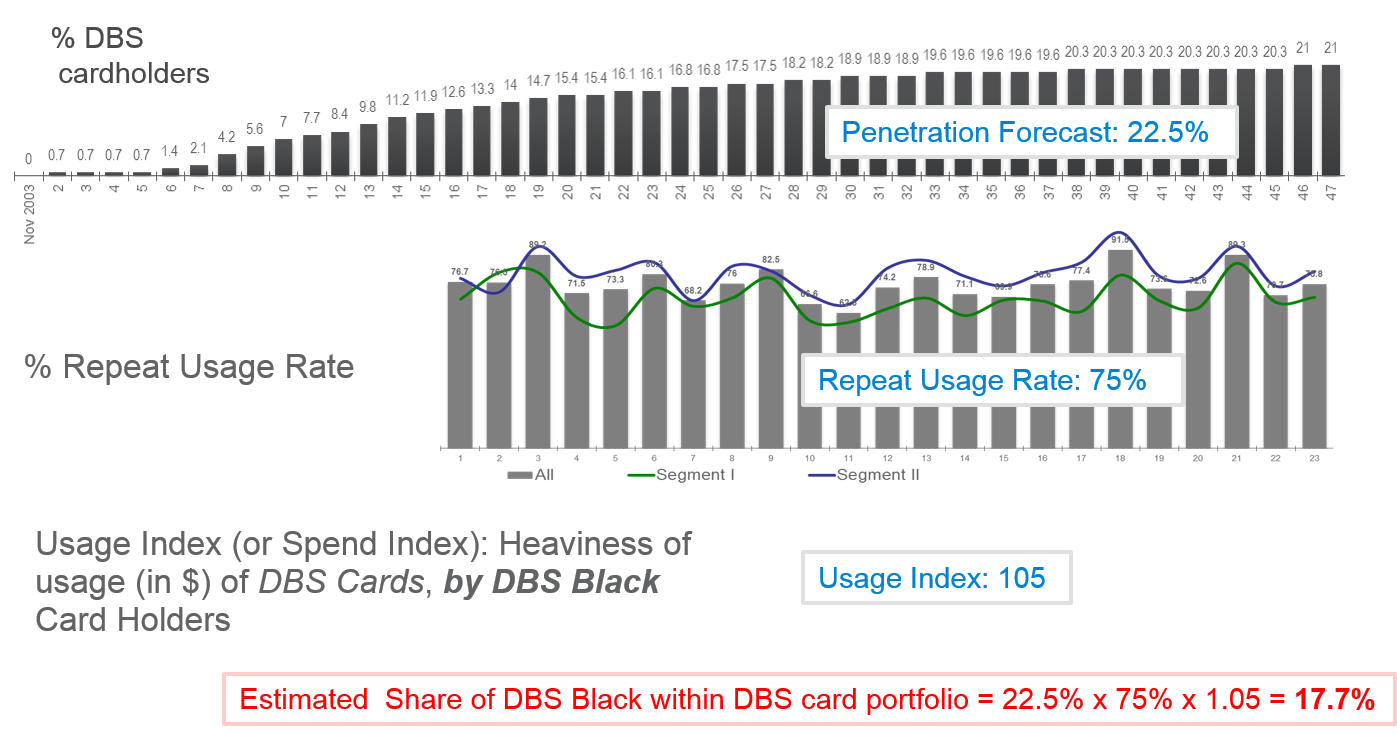
Share Prediction
Based on penetration, repeat usage rate and use index, the model predicts that DBS Black Card will contribute about 18% of the usage (in $ terms) of DBS cards.
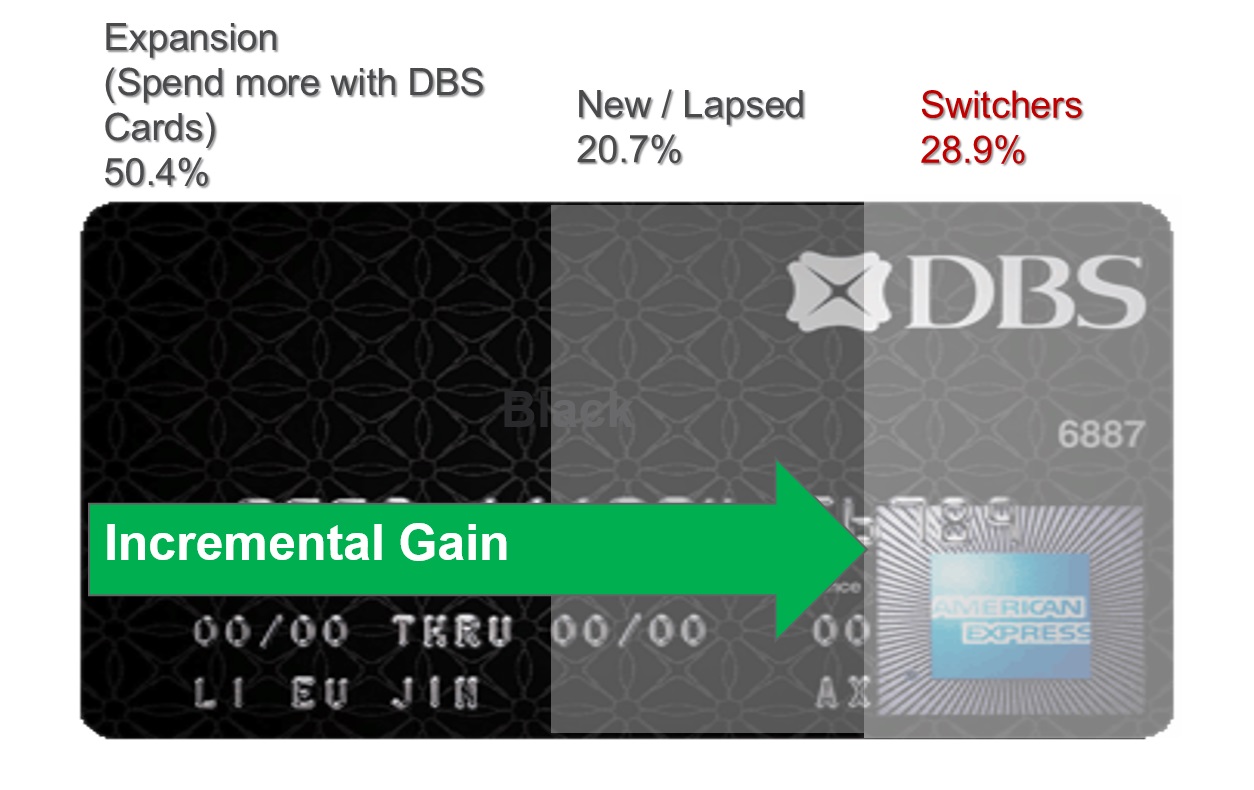
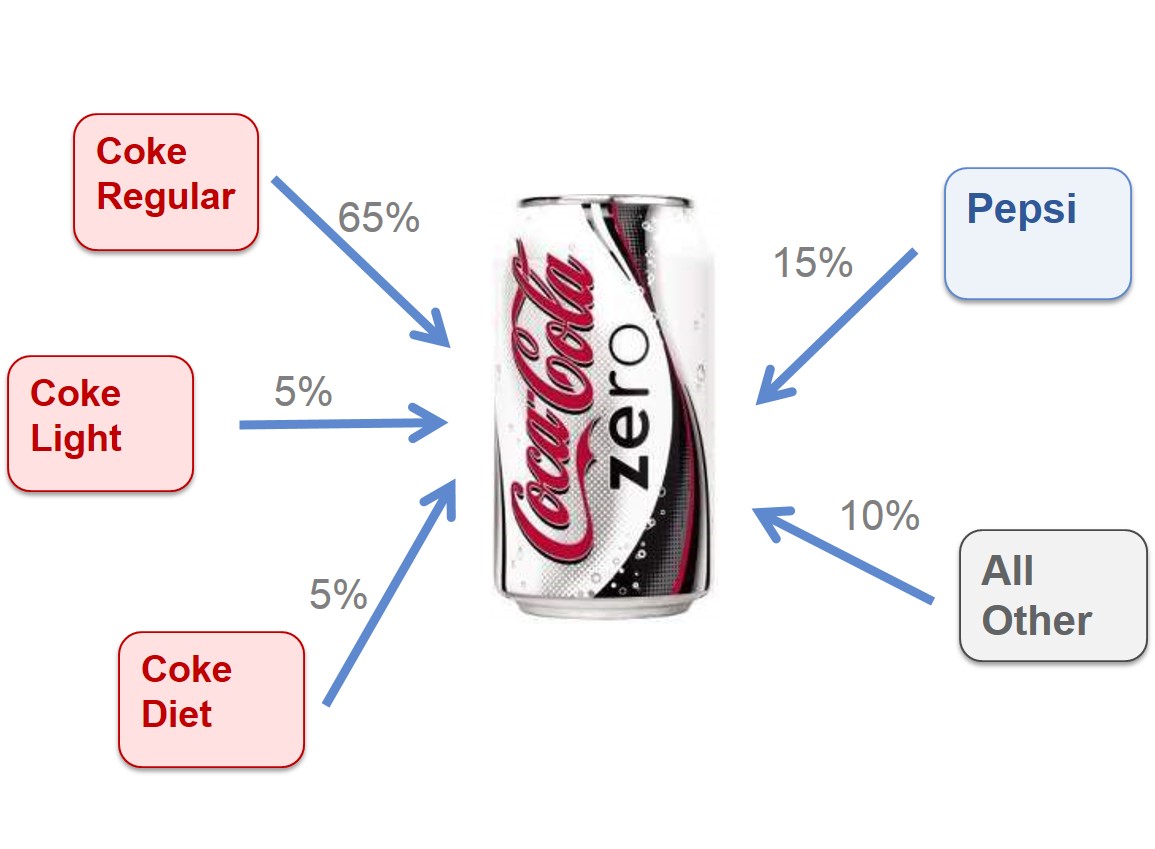
Gain-Loss: Source of Growth
Gain loss reveals that DBS Black has resulted in the growth of the DBS Cards portfolio.
A little over half the source of growth of DBS Black is due to increase in spend by these customer. A further 20.7% of DBS Black card holders’ spend is emanating from new or lapsed DBS card customers.
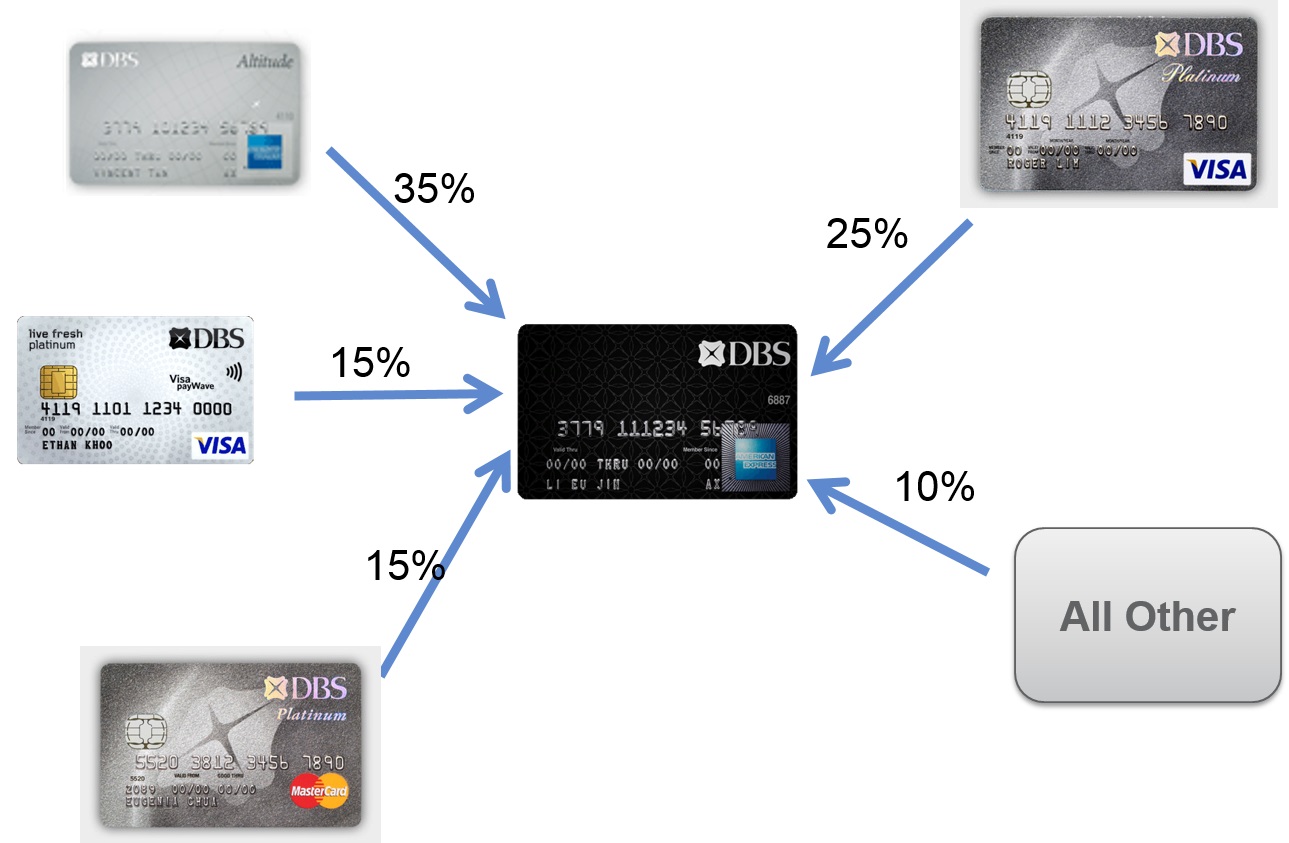
Gain-Loss: Cannibalization
Most of DBS Black’s gains through cannibalization are emanating from DBS Altitude and DBS Platinum Card.

DBS Black - Launch Evaluation
DBS Black is expected to contribute about 18% of the usage, in terms of dollars spent, of DBS cards.
It is driving the growth of the DBS Cards portfolio. A little over half the source of growth of DBS Black is due to increase in spend by these customer. A further 20.7% of DBS Black card holders’ spend is emanating from new or lapsed DBS card customers.
Example (disguised): DBS Black.
The fictitious DBS Black case example presented above illustrates a range of analytical tools used to assess and validate new products. Key metrics such as trial rates, repeat usage, and the buying index serve as crucial indicators of a new product’s success, enabling analysts to forecast its potential market share. In this example, since the data source is assumed to be the bank’s transactional data, it provides an estimate of the contribution the new card is likely to make within DBS’s portfolio of credit and debit cards.
A critical aspect of this analysis is understanding the new product’s overall impact on the bank’s total business. This involves addressing key questions such as:
- How much incremental business is the new card likely to generate?
- To what extent does it cannibalise other DBS card products?
Gain-loss analysis, which measures how much business each product gains from or loses to competitors, is particularly useful in answering these questions. Additionally, overlap analysis helps assess the level of duplication within a portfolio of products.
Brand managers are ultimately focused on enhancing their brand’s performance. They aim to drive more customers to try new offerings and encourage existing customers to use them more frequently. Behavioural diagnostics derived from transactional data analysis, when combined with attitudinal insights from surveys and other research sources, provide valuable insights to guide strategic decisions.
For a deeper exploration of consumer analytics, refer to the Consumer Analytics and Consumer Panels chapter in the Marketing Analytics eGuide, which covers various techniques, examples, and case studies.
While analytics reveals what consumers do, this behavioural data may only hint at what they think. To gain a clearer understanding of consumer attitudes, perceptions, and beliefs, businesses must complement analytics with qualitative and quantitative research.
 Benefits of Customer Behavioural Data
 Benefits of Customer Behavioural Data
Customer behavioural data is a gold mine for marketers, offering numerous advantages:
- Richness and Detail – The power of this data lies in its continuous, disaggregate nature. Disaggregate data is far more revealing than aggregate data, making it particularly effective for diagnosing consumer behaviour.
- Large and Granular Databases – These databases tend to be vast, allowing analysts to drill down into even the smallest customer segments. Transactional and big data, in particular, enable micro-segmentation and even personalised marketing, such as targeted promotions and communications.
- Actionability – While the data may not always represent the total market, it is highly actionable. It facilitates tactical execution at the segment level and across specific locations, such as stores, banks, or websites.
- Deeper Consumer Insights – Unlike aggregate data, which can compute broad metrics like market share, disaggregate data provides richer insights into breadth and depth of consumption, brand loyalty, switching behaviour, purchase baskets, and more.
- Predictive Capabilities – Behavioural data reveals not only current and historical trends but also predicts future behaviour. For instance, techniques based on disaggregate data can accurately forecast the market share of a new product shortly after its launch.
- Growth Estimation – It helps estimate growth and identify sources of growth. Gain-loss analysis, for example, uncovers switching patterns between brands.
- Marketing Impact Measurement – The data reveals the immediate and long-term impact of marketing activities, providing valuable insights into how strategies influence consumer behaviour over time.
- Customer Value Identification – It helps businesses identify their most valuable customers and tailor marketing efforts accordingly.
- Integration of Physical and Digital Worlds – By integrating data from both offline and online interactions, businesses gain deeper insights that enhance targeting and engagement strategies.
- Transparency and Accountability – Access to accurate, comprehensive data fosters greater transparency, enabling businesses to measure performance more effectively and make data-driven decisions with confidence.
Contact
Ashok Charan,
Marketing Analytics Practitioner’s Guide,
Digital Marketing,
Marketing Mind,
Destiny Marketing Simulator,
 ashok.charan@gmail.com


