
Market Intelligence and Data Visualization
Market information is often disorganized. It resides in silos, and is cumbersome, inconvenient and unfriendly to use. The discomfort that this creates, results in sub-optimal utilization of the information. Besides the opportunity cost, the time it consumes to browse and digest ineptly managed data is an ever increasing value drain.
To better organize market intelligence, system developers avail of the wide array of data processing and visualization tools that provide facilities for efficiently retrieving, analysing and reporting data. If these tools are effectively utilized, it should be feasible to manage and organize information in a manner that is user friendly, so that associates struggle less and gain more, and organizations pay less and derive far greater benefits.
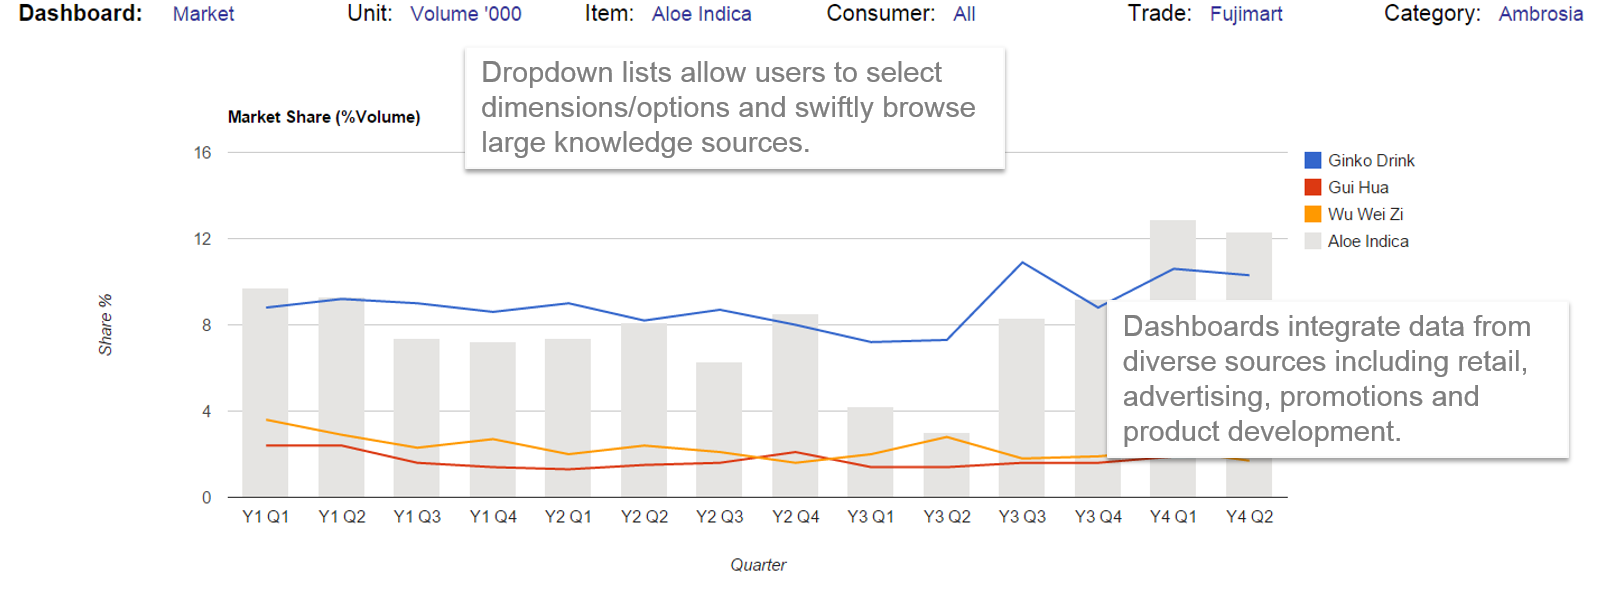
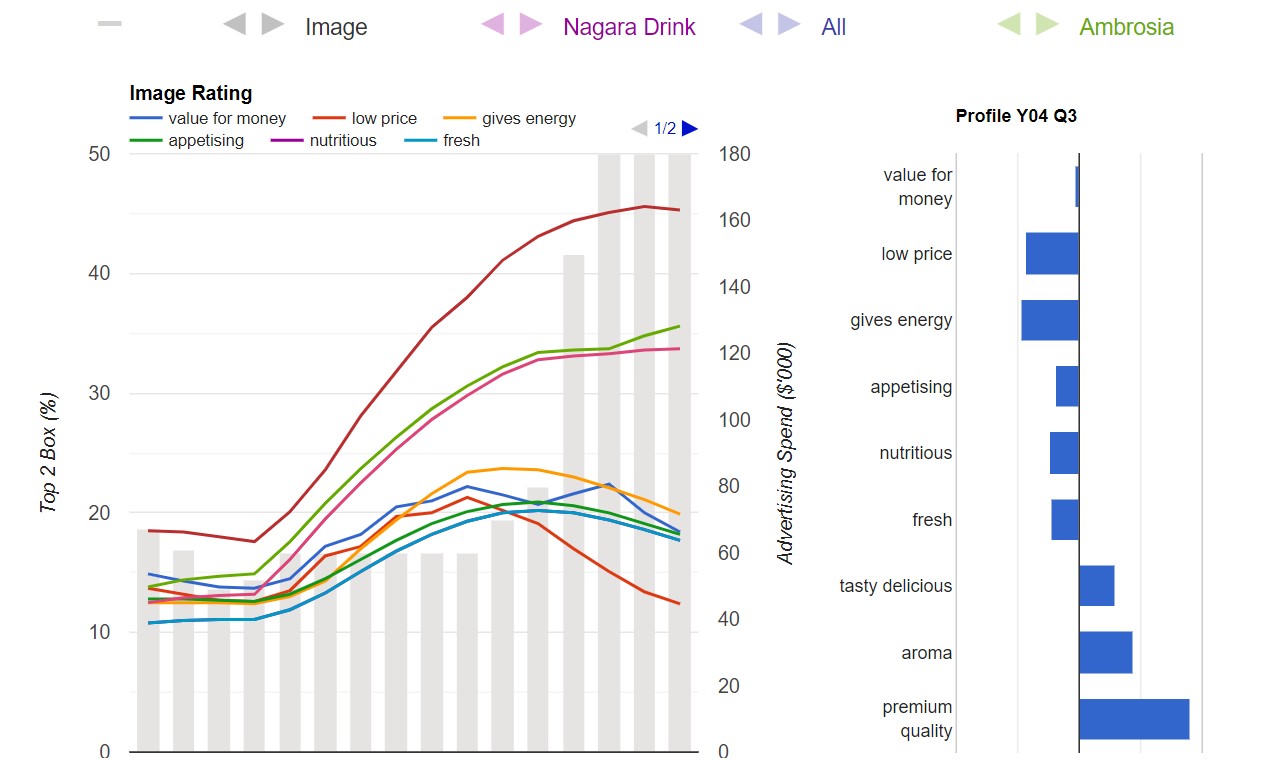
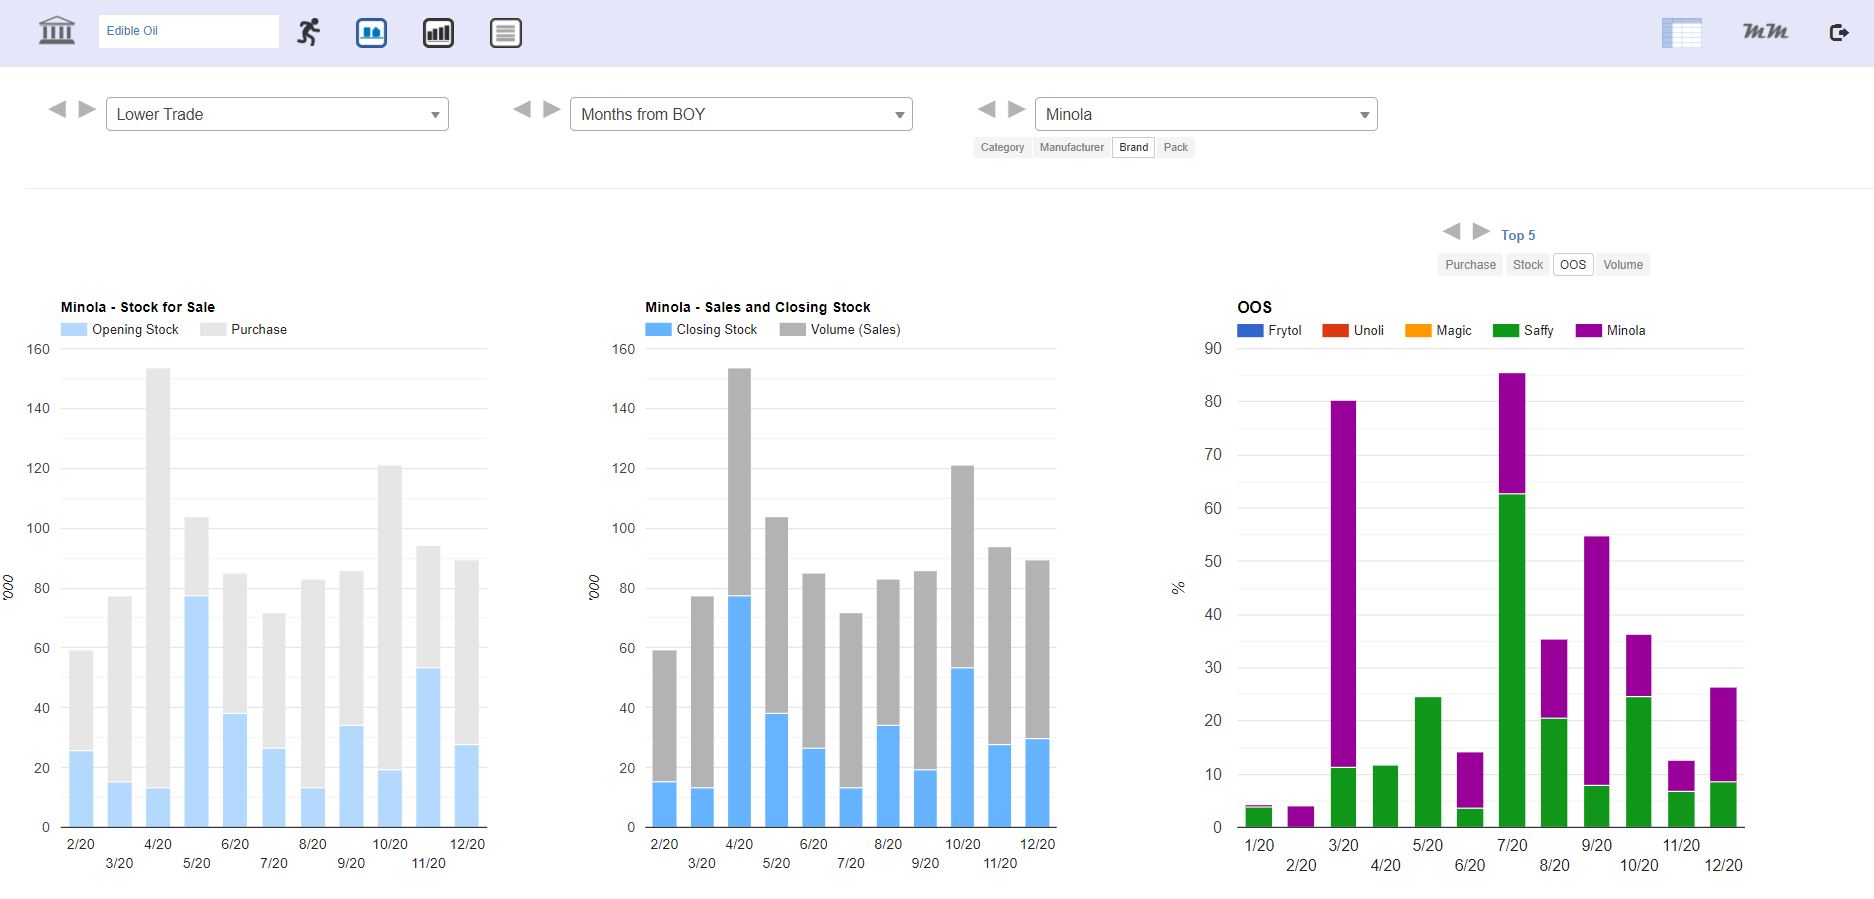
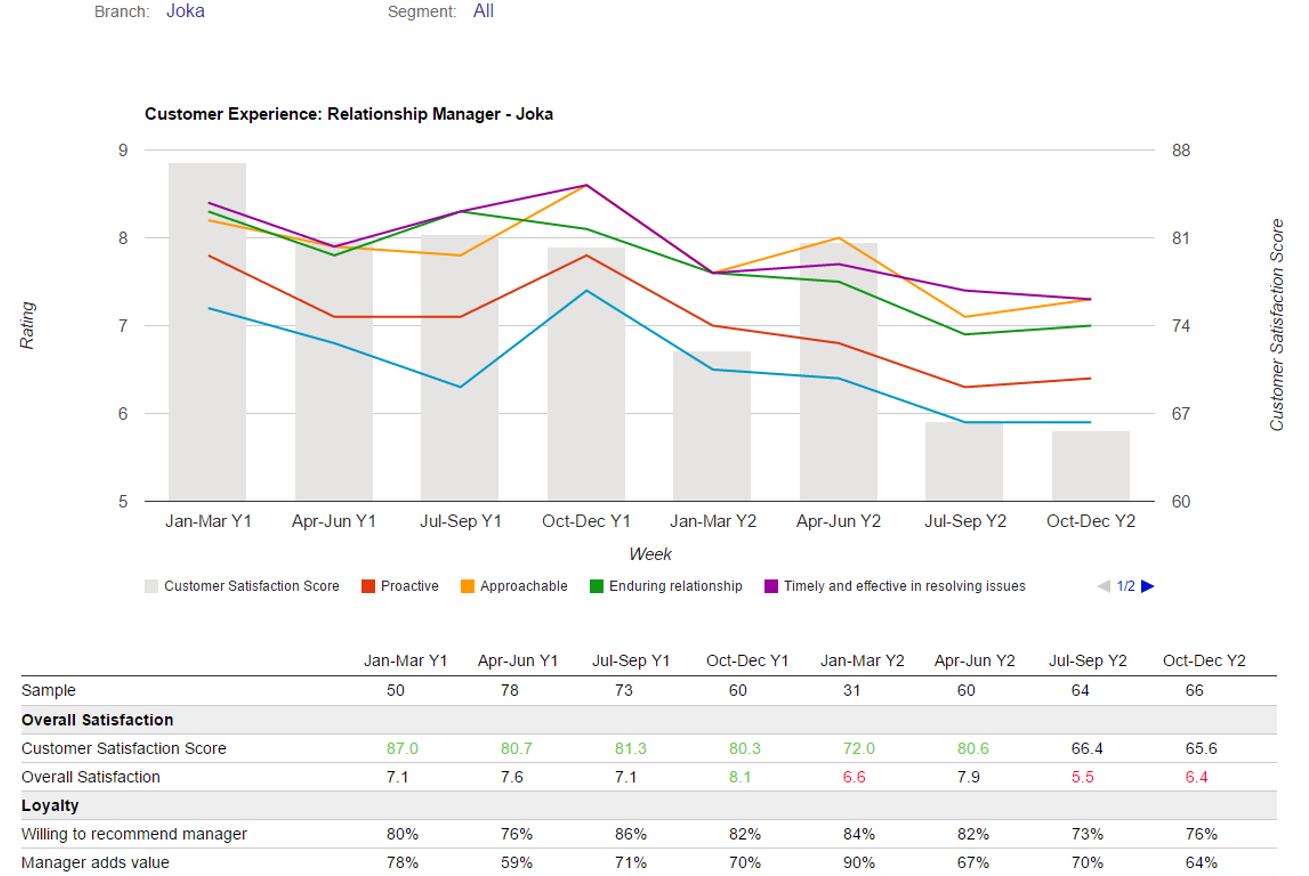
As illustrated by this suite of interactive, online dashboards, information should be seamlessly integrated and presented in a manner that makes it easier to glean insights. Each dashboard should be designed to present the right combination of information to address particular business issues. For instance, brand health, advertising, promotion, product, trade or the market in general.
The solution, taken from the Destiny marketing simulator, is crafted so that marketers can take informed decisions quickly, without getting overwhelmed by the intricate backend that comprises well over 100 variables, across more than 10,000 combinations of dimensions. (Destiny is an experiential learning tool used in marketing workshops).
From the standpoint of system design, to ensure that time sensitive market information always remains current, rather than store data in a warehouse, it is preferable to pull the required information directly from a network of data sources. This is achieved by means of wrapper routines that extract the required information from the respective databases.
Contact
Ashok Charan,
Marketing Analytics Practitioner’s Guide,
Digital Marketing,
Marketing Mind,
Destiny Marketing Simulator,
 ashok.charan@gmail.com


