For one-tailed, known mean and standard deviation tests
the test statistic to use is the z-score.
Example: A range of initiatives, including increases in excise duty,
constraints on pack sizes, and restrictions on distribution channels, were implemented with
the aim of reducing cigarette consumption. The government set a target of decreasing
consumption to below 120 sticks per smoker per month.
To evaluate the effectiveness of these measures, a study was conducted,
involving 100 smokers. The findings revealed that, on average, each smoker consumed 28 sticks
per week, amounting to 112 sticks per month.
To provide further context, an earlier large-scale consumption study estimated
the standard deviation of cigarette consumption to be 40 sticks per month.
Based on these findings, can we conclude whether the government achieved
its target?
H0: μ ≥120
HA: μ<120
α = 5%
$$ z = \frac{\bar x-μ}{s/\sqrt n} = \frac{112-120}{40/10} = -2.0 $$
p-value = 0.023 < α = 0.05
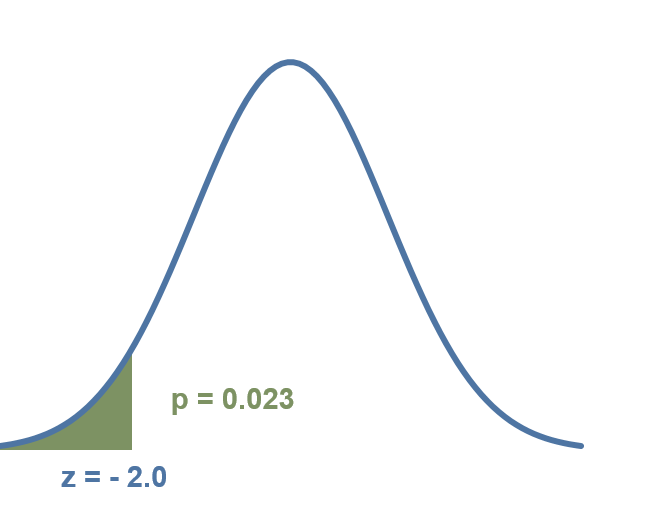
Exhibit 34.21 Probability that the sample average consumption of cigarettes is less than 120 is 0.023 or 2.3%.
The p-value, as depicted in Exhibit 34.21, indicates that the
probability of obtaining a z-score of −2.0 or lower is 0.023. Using this information,
we can infer that there is a 97.7% probability (1 − 0.023) that the government’s
initiatives have effectively achieved the objective of reducing cigarette consumption to less
than 120 sticks per month.
The null hypothesis is rejected because the p-value, 0.023 (2.3%), is less than α, 5%.
Note: A p-value from z-score calculator is provided on this
webpage.


