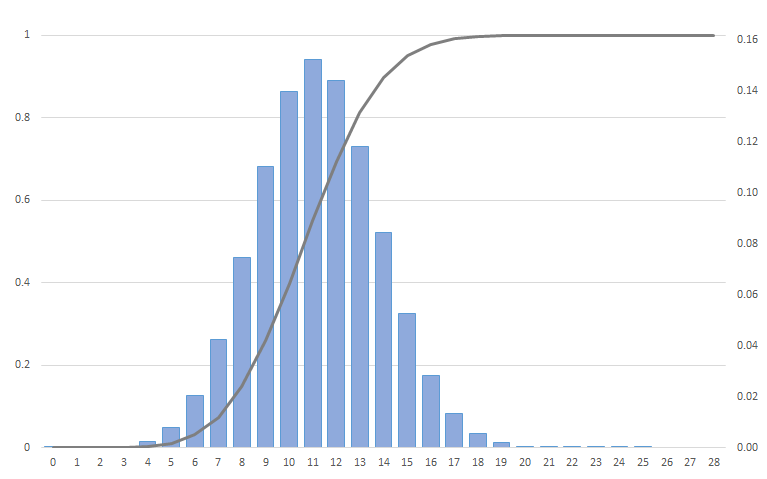
Exhibit 34.10 Binomial distribution for n=28, p=0.4.
The binomial distribution models the number of successes in a sample of size
n drawn with replacement from a population of size N. If the sampling is carried out
without replacement, as is usually the case in research programmes, the draws are not independent.
However, where the population N is much larger (at least 10 times larger) than n, the
binomial distribution is a good approximation.
If the random variable X follows the binomial distribution with parameters
n ∈ N and p ∈ [0,1], we write X ~ B(n, p). The probability of getting exactly
k successes in n trials is given by the probability mass function (Exhibit 34.10):
$$ P(X=k) = \binom{n}{k}p^k(1-p)^{n-k} $$
Where:
$$\binom{n}{k}=\frac{n!}{k!(n-k)!}$$
The mean and variance of this distribution is:
$$mean,\, E(X)= \bar{p} = µ_X = np $$
$$variance,\, Var(X)=σ_X^2= np(1-p)$$
Note: In Excel you may use the BINOM.DIST (k, n, p, cumulative) function to compute
P(k).


