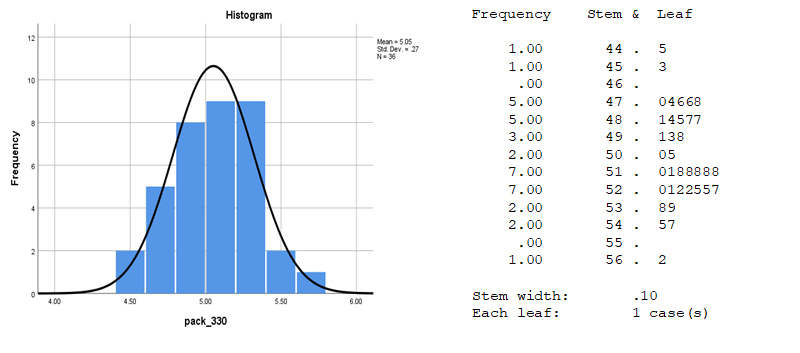
Exhibit 34.27 Histogram and Stem & Leaf plot reveals the shape of the distribution.
The Stem & Leaf plots also enumerates the actual values. (Source: SPSS).
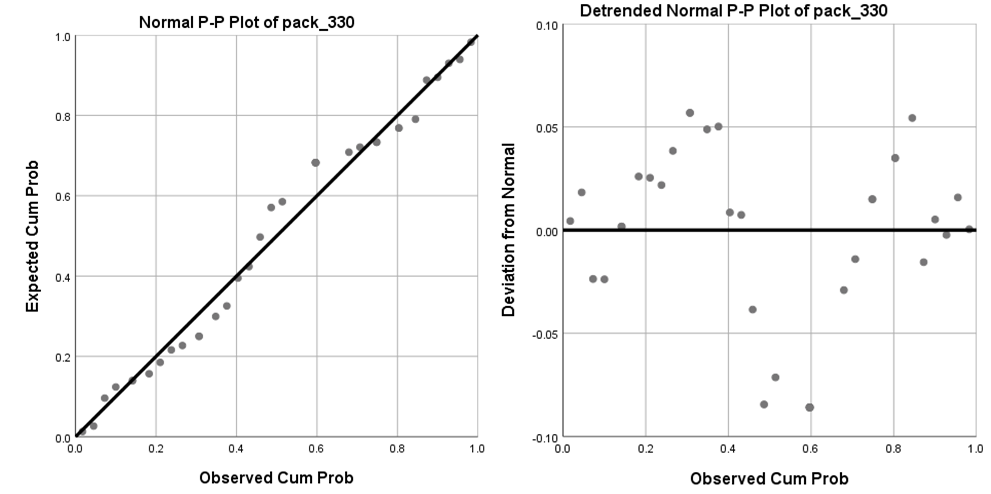
Exhibit 34.28 The normal probability plot and the de-trended normal probability plot.
(Source: SPSS).
The dependent and independent variables are assumed to follow normal distribution.
Furthermore, in the case of multiple regression, this assumption is also applicable to the combination
of variables.
If their distributions vary substantially from the normal distribution, the F
test, which assesses the overall regression, and the t-test, which assesses statistical
significance of the coefficients, may no longer remain valid. These tests assume that the residuals
are distributed normally.
Univariate normality can be visually examined through the histogram and the stem & leaf
plot (Exhibit 34.27), though this may be problematic for smaller samples. The normal probability
plot, Exhibit 34.28, is a more reliable check. This compares the cumulative distribution of the
data with that for a normal distribution. If data is normal, it is scattered close to the diagonal which
represents the theoretical normal distribution.
Additionally, the Kurtosis statistic tests for “peakedness” or “flatness” of the
data, and the skewness statistic is a measure for skewness.


