Determining the death rate of infectious diseases such as the Coronavirus
Feb 16, 2020
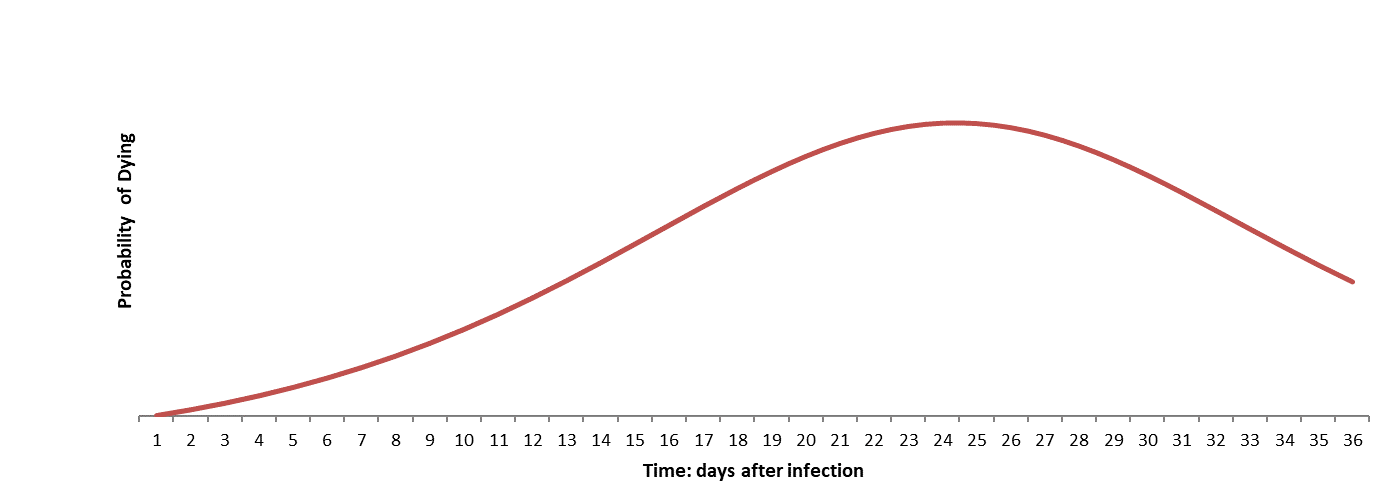
Exhibit Probability distribution dying (illustration only). (Assumes peak at 24 days
after infection). The death rate is the area under the curve.
How deadly is Covid-19? As of now, we do not know. Yet, with access to
accurate case records, we can answer this question with fairly high level of confidence,
even at a relatively early stage of the spread of the disease.
What we do know, based on the death toll, is that the coronavirus is deadlier than SARS.
In general, two factors determine the lethality of an infectious disease:
- Infection rate (R0): the average number of people a case infects.
- Death rate: the number of infected people who are likely to die.
The infection rate according to medRxiv and CIDRAP, varies from 1.3 for the seasonal flu,
to 3 for SARS and 15 for measles. For the coronavirus, estimates range from 2.2 to 6.6.
Since the pace at which it proliferates in China is far greater than that for SARS, chances
are the infection rate is likely to be at the upper end of this range.
The death rate can be determined from the probability distribution curves, such as the one
depicted in the above Exhibit. In this illustration, the probability of dying increases over
time peaking at 24 days, and declining thereafter.
The death rate is the area under the curve.
Early assessments of the death rate are likely to be gross underestimates if they are based
on the simple ratio of deaths over infections. These ratios are very low at the inception
and during the phase when the disease is spreading.
Also with heightened awareness, and extensive controls and checks in place, a higher proportion
of milder cases are reported. Under normal circumstances some of these cases may not be
counted, and their reporting understates the death rate.
To accurately estimate the death rate we need to derive the probability distribution of deaths
caused by the disease.
To begin, one might filter out those cases that are so mild that they may not have been counted
under normal circumstances. Infected cases should then be split into cohorts based on the date
of infection. The cohorts are lined up according to days since infected, combining to form a
more reliable sample.
Aligned this way and monitored over time, the cases yield the proportion of deaths on days after
the infection occurs. This information can be modelled to determine the structure and parameter
of the probability distribution curve, the area under which is the death rate.


