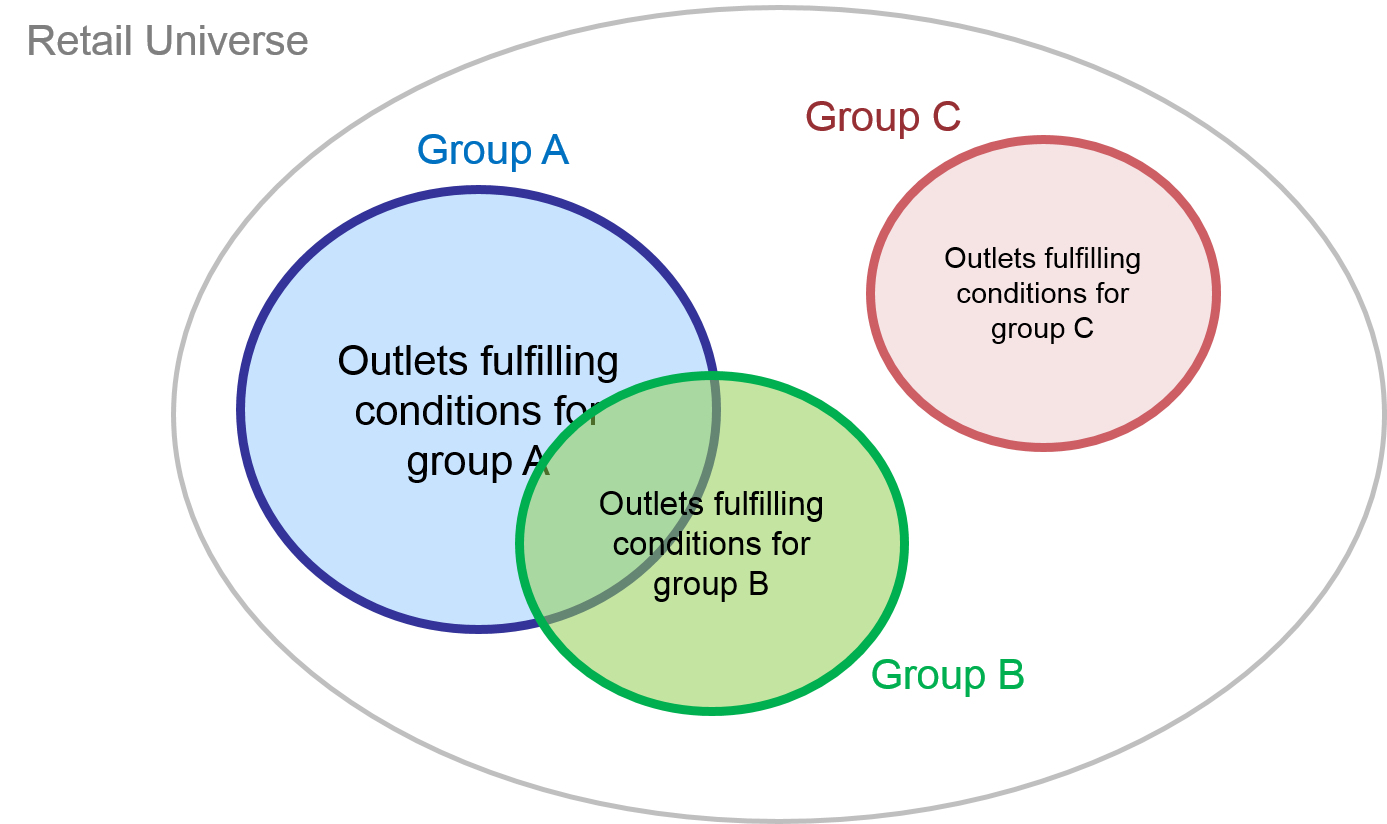
Exhibit 32.1 Forming outlet groups.
Continuous data on shoppers and their transactions
is a data mine that can help diagnose business issues.
Whereas chapters Retail Tracking and Sales and Distribution focussed on
aggregate data analytics (i.e., aggregated to market breakdowns such as chain, channel,
region and country), this chapter covers analyses of disaggregate or outlet level data
which tends to be more diagnostic in nature.
The term “retail analytics” is commonly in use in
ways that tend to overlap with related areas such as “consumer analytics” and “retail
tracking”. Since each of these topics is covered in separate chapters, let me clarify that
in context of this chapter, retail analytics relates to the analysis of continuous
outlet level data pertaining to shoppers and their transactions.
Retail Tracking Databases
Data sourced from point-of-sale (POS) scan terminals
and retail audits, generates continuous transaction data that feeds into retail analytics.
Whereas the retail tracking service aggregates the data to capture market size, share and
distribution for market breakdowns, retail analytics analyses the data at the disaggregate
or outlet level.
Fundamental to retail analytics is the filtering
of retail outlets to form outlet groups (Exhibit 32.1). For instance, an analyst
might be interested in examining outlets that stocked a particular brand
compared with outlets that did not stock that brand. Or outlets that offered a
promotion versus outlets that did not do so.
This chapter describes a wide array of outlet group
analysis addressing aspects such as brand handlers’ analysis, brand overlap, assortment, shelf space,
pricing, promotion and rate of sales.
Customer Transaction Databases
Customer transaction data (e.g.,
shopper transactions data, consumer panel data, loyalty panel data)
also feed into retail analytics. These databases have the customer dimension in
addition to the outlet dimension, thus adding an additional layer of diagnostic
capabilities. The data can be used to compute chain or outlet penetration,
spend per customer, chain loyalty, cannibalization among outlets and so on,
using similar concepts, tools and techniques that are applicable for the
analysis of consumer panels.
The analysis outlined in this chapter include
customer profile, loyalty and propensity, assortment analysis, overlap, outlet
group, outlet repertoire, gain–loss, trial and repeat visit, penetration and
repeat rate, and sales forecasting. A case example pertaining to the opening of
a new petrol station illustrates a number of these analyses.