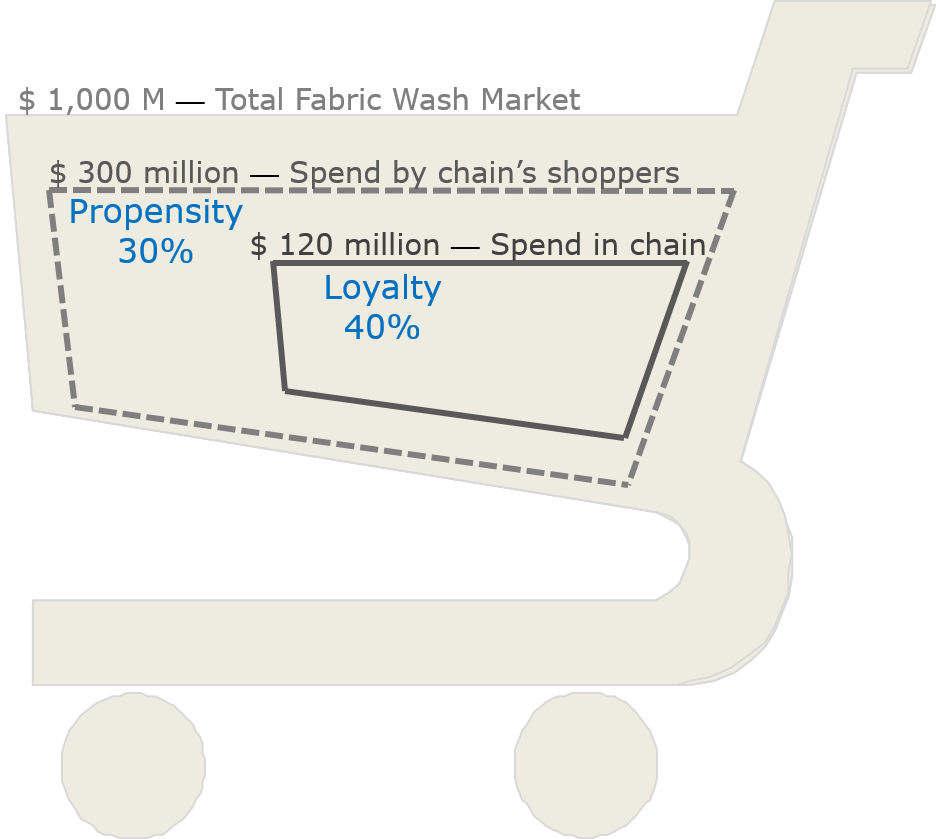
Exhibit 32.4 Loyalty and propensity.
Customers typically visit a repertoire of outlets, and
they spread their transactions across these outlets. Retailers therefore get only a proportion
of their spend. Behavioural loyalty tells us what that proportion is. It is defined as the
retailer’s share of category sales among its customers, and it may be measured in terms of
volume or value.
Take for example the consumer panel data on the FMCG fabric wash category depicted
in Exhibit 32.4. The total market size is $1 billion. Shoppers that shop at a particular retail
chain spend a total of $300 million across all outlets where they shop. Of this amount they spend
$120 million at the retail chain. Their behavioural loyalty to the chain is therefore 40%
(= $120M/$300M).
The retailer can theoretically grow category sales by improving chain loyalty. In
this example, sales could increase to a maximum value of $300 million if loyalty rose to 100%.
The retailer could also grow category sales by attracting more shoppers to shop at
its stores (i.e., increasing store traffic), or by increasing the amount they spend on the category.
This leads to the concept of retailer propensity which is the proportion of total
category sales coming from the retail chain’s shoppers. In the above example the retailer’s
propensity for fabric wash is 30% (= $300M/$1000M).
It follows from the stated definitions that a chain’s share of trade in a category
is the propensity of shoppers to shop at the chain for that category multiplied by the behavioural
loyalty of the chain’s shoppers.
$$ Market \, Share = Propensity \times Loyalty$$
Due to variations in the consumption habits of their shoppers, retailers can have
relatively high propensity for some categories, and low for others. For instance, if the chain’s
shopper’s demographic profile is skewed towards families with babies, then its propensity for
categories like infant milk and diapers is likely to be high.
Note: As mentioned earlier loyalty and propensity cannot
be computed with data that is confined to the retailer’s own transactions, as is the case with
loyalty panel data. Both these measures require an assessment of customers’ transactions across
the entire market.