
Retail Analytics — Case Example: Evaluation of Opening of New Petrol Station
This example pertaining to the opening of a new petrol station at Novena, a prime area in Singapore, is based on analysis of loyalty panel data of a chain of petrol stations. It computes the trial, repeat usage rate and usage index to provide an estimate of the outlet’s share or contribution within chain. It also examines the source of volume of the new station, and the overlap in usage.
Outlet Trial
For a new outlet to flourish, it must develop a base of regular customers — i.e., motorists who try it and continue using it. The outlet’s success hinges therefore on trial and repeat usage.
Trial or cumulative penetration at a time t is the percentage of customers who transacted at the outlet from the time it was opened till time t.
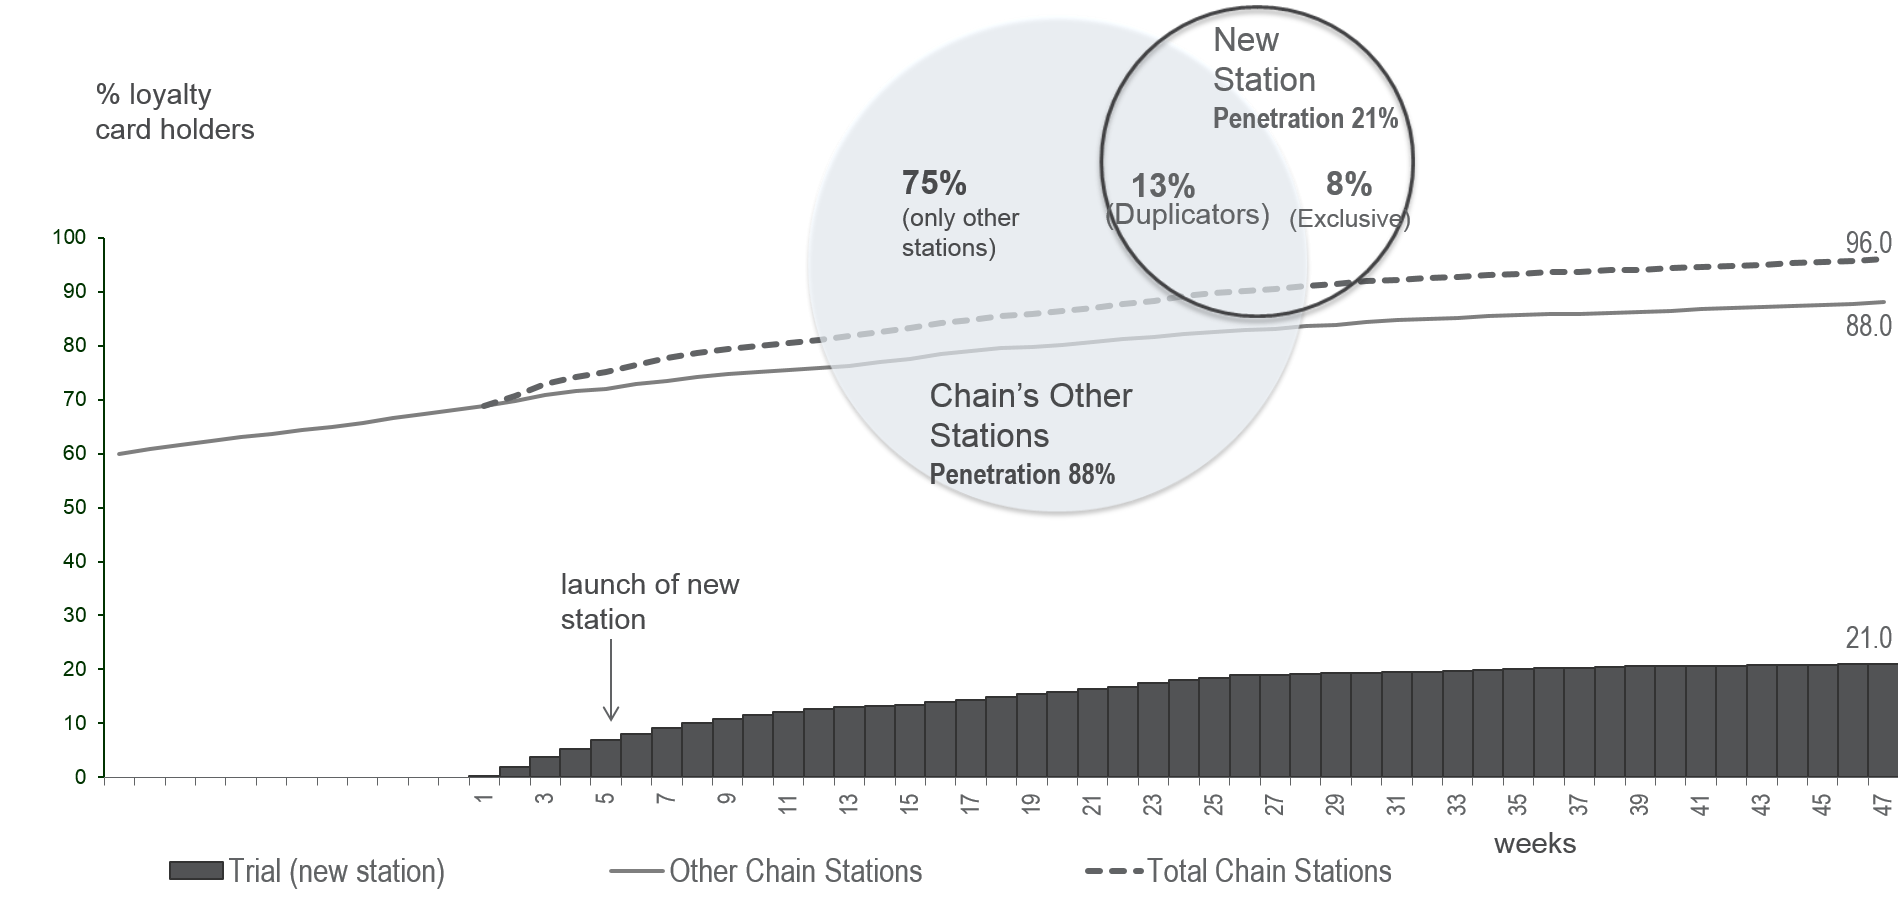
As can be seen from Exhibit 32.6, the proportion of loyalty card holders who pumped petrol at the Novena petrol station rose steadily to 21% by the 47th week after its opening. The penetration for all other stations in the chain also increased over this time to 88%, and total chain penetration reached 96% in week 47.
The stable repeat usage rate (RUR) estimate was 28%, and the usage index was 1.02. These measures akin to RBR (repeat buying rate) and buying index are covered in detail under the TRB Share Prediction model in Chapter Product Validation.
RUR is a measure of repeat usage, and usage index is a measure of the heaviness of usage. A usage index of 1.02 means that motorists who pump at Novena spend, on average, 2% more on fuel.
Based on the model, the estimated contribution of the new petrol station to the chain’s total petrol sales is 6.0% (=21% × 28% × 1.02).
It would interest the chain’s management to know how many of the motorists who frequent the new station exclusively pump at that station, and how many of them are “duplicators” who are also pumping at the chain’s other stations. This information may be gleaned from the overlap analysis which is also presented in Exhibit 32.6.
Overlap Analysis
The overlap analysis shown in Exhibit 32.6 filters out three groups of motorists based on where they fill petrol:
- Only Novena: Motorists who only pump at the new petrol station.
- Duplicators: Motorists who pump at Novena as well as at some of the other stations.
- Only others: Motorists who pump at stations other than the new petrol stations.
The analysis reveals that 8% of the loyalty card holders pump the chain’s fuels exclusively at the new station. These motorists may also be going to competing chains, but they have not been pumping at the chain’s other stations. They represent the incremental gain resulting from the addition of the new station, especially if they are new card holders or if their consumption of fuels at the chain has increased.
Having filtered them out, it is possible to analyse the exclusive Novena motorists further in terms of their profile, consumption levels etc. and compare them with the chain’s other motorists.
The presence of “duplicators” suggests cannibalization. This is inevitable whenever a new outlet is added.
Gain–loss analysis can estimate for cannibalization. It can also reveal the extent that the launch of the Novena petrol station led to an increase in the amount of petrol the duplicators pumped at the chain.
Gain–loss
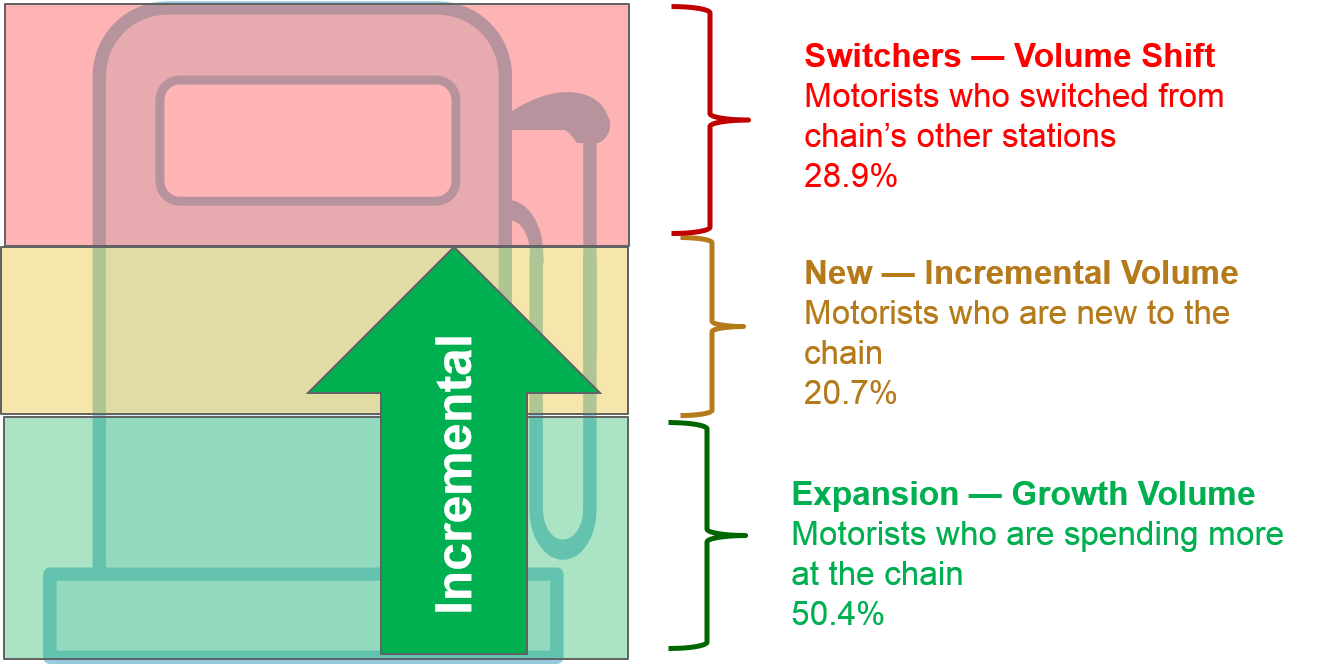
Exhibit 32.7 Source of growth analysis for new station (analysis over the 13 week period — weeks 35 to 47 versus the 13 weeks prior to opening).
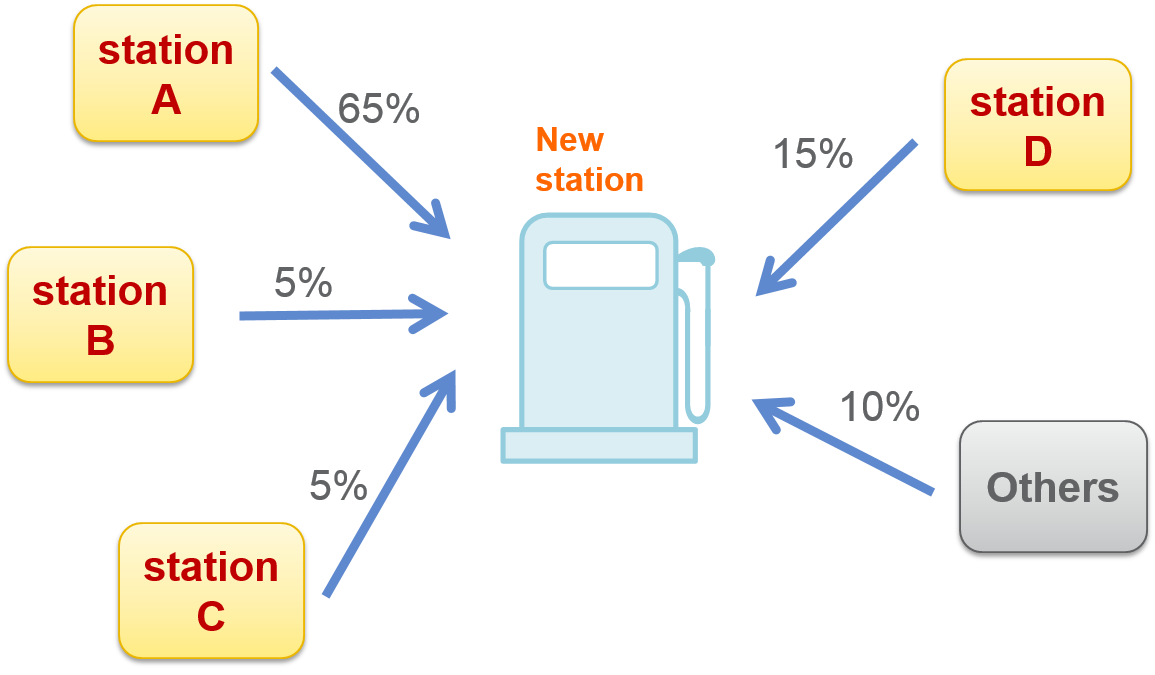
Exhibit 32.8 Analysis of cannibalization.
The gain–loss analysis measures competitive shifts in usage in terms of the amount of business each outlet (petrol station) gains from other outlets. For details on the algorithms and gain–loss methodology, refer Section Gain–loss in Chapter Consumer Panel.
The gain–loss results in Exhibit 32.7 reveal the source of growth for the Novena petrol station. About 21% of the volume is from motorists who started pumping fuels from the chain after the new station opened. This is predominantly incremental volume for the chain.
Gains are also accruing from motorists who are spending more on fuels since the Novena station was opened. This represents 50.4% of Novena’s source of growth.
The remaining 29% of Novena sales is attributed to cannibalization. This is the proportion of business that the new station acquired from other stations belonging to the chain.
The high incremental volume (50.4% + 20.7%) suggests that the new outlet gained considerable volume from competition. However, since the analysis is based on the chain’s loyalty data, it is not possible to identify which competing petrol stations contributed to Novena’s growth.
Gain–loss does however reveal which of the chain’s petrol stations were cannibalized by the new station. The analysis, presented in Exhibit 32.8, tells us that the majority of the cannibalized sales (65%) came from station A. Stations D, B and C were also significantly affected.
Previous
Use the Search Bar to find content on MarketingMind.
Online Apps to train Category Managers
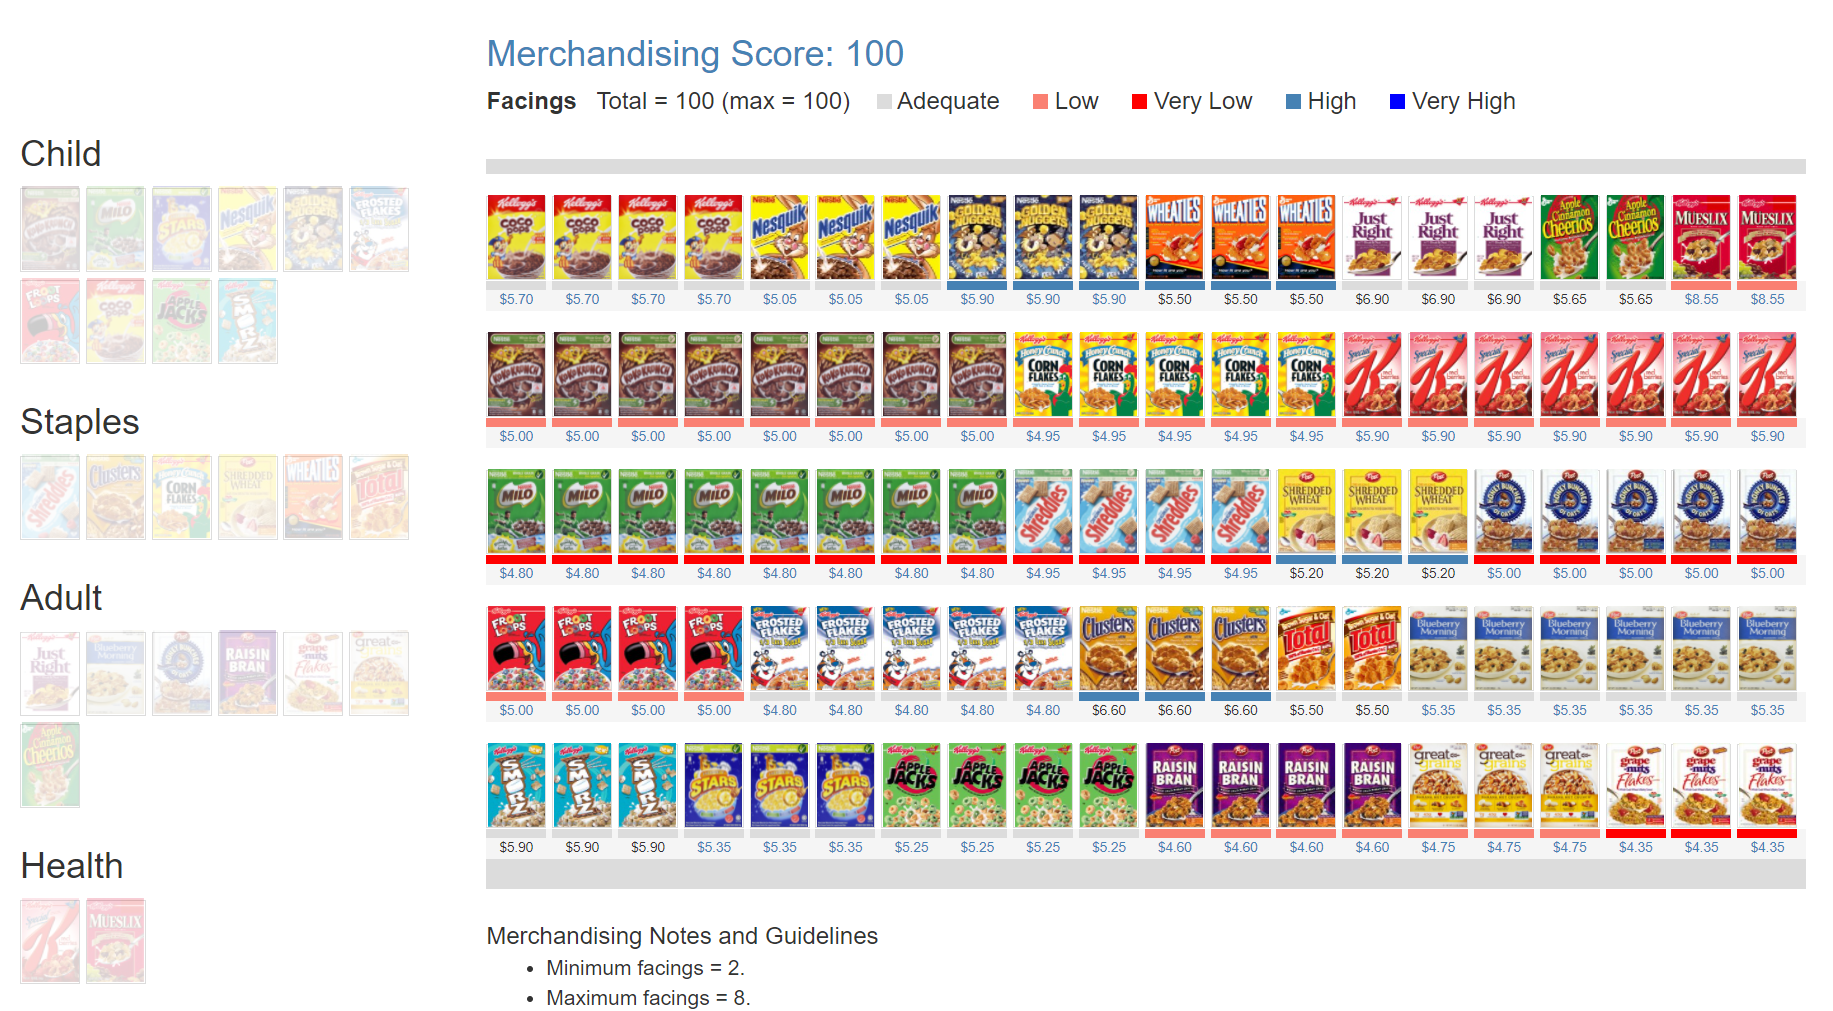
The Plannogrammer is an experiential learning facility for category managers, trade marketers, and retailers in consumer markets. Ideally suited for hybrid learning programmes, Plannogrammer imparts hands-on training in the planning and evaluation of promotions and merchandising.
It supports a collection of simulation and analysis platforms such as Promotions and Space Planner for optimizing space and promotions, Plannogram for populating shelves and merchandising, a Due To Analysis dashboard that decomposes brand sales into the factors driving sales, and a Promotion Evaluator to evaluate the volume, value and profit impact of promotion plans.


Contact | Privacy Statement | Disclaimer: Opinions and views expressed on www.ashokcharan.com are the author’s personal views, and do not represent the official views of the National University of Singapore (NUS) or the NUS Business School | © Copyright 2013-2026 www.ashokcharan.com. All Rights Reserved.