
-
Consumer Panels & Consumer Analytics
Consumer Panels & Consumer Analytics
Research Methodology
Width and Depth of Purchase
Buyer Groups
Profile Analysis
Brand Loyalty (Behavioural)
Trial and Repeat
Purchase Frequency
Repeat Decay Curve
Overlap
Basket
Gain-loss
Example — Johnson’s Body Care
- Segmentation
- Qualitative Research
- Quantitative Research
- Customer Satisfaction and Customer Value
- Consumer Panels and Consumer Analytics
- Big Data and Consumer Analytics
- Marketing Education
- Is Marketing Education Fluffy and Weak?
- How to Choose the Right Marketing Simulator
- Self-Learners: Experiential Learning to Adapt to the New Age of Marketing
- Negotiation Skills Training for Retailers, Marketers, Trade Marketers and Category Managers
- Simulators becoming essential Training Platforms
- What they SHOULD TEACH at Business Schools
- Experiential Learning through Marketing Simulators
-
MarketingMind
Consumer Panels & Consumer Analytics
Consumer Panels & Consumer Analytics
Research Methodology
Width and Depth of Purchase
Buyer Groups
Profile Analysis
Brand Loyalty (Behavioural)
Trial and Repeat
Purchase Frequency
Repeat Decay Curve
Overlap
Basket
Gain-loss
Example — Johnson’s Body Care
- Segmentation
- Qualitative Research
- Quantitative Research
- Customer Satisfaction and Customer Value
- Consumer Panels and Consumer Analytics
- Big Data and Consumer Analytics
- Marketing Education
- Is Marketing Education Fluffy and Weak?
- How to Choose the Right Marketing Simulator
- Self-Learners: Experiential Learning to Adapt to the New Age of Marketing
- Negotiation Skills Training for Retailers, Marketers, Trade Marketers and Category Managers
- Simulators becoming essential Training Platforms
- What they SHOULD TEACH at Business Schools
- Experiential Learning through Marketing Simulators
Consumer Panels — Gain–loss
Also known as brand switching or brand shifting analysis, the objective of gain–loss is to measure competitive shifts in consumer buying in terms of the amount of business each product gains from other products. Much-loved by consumer analysts, it analyses disaggregate data to answer questions relating to switching behaviours — What is my brand’s source of growth or decline? Which brands are being cannibalized?
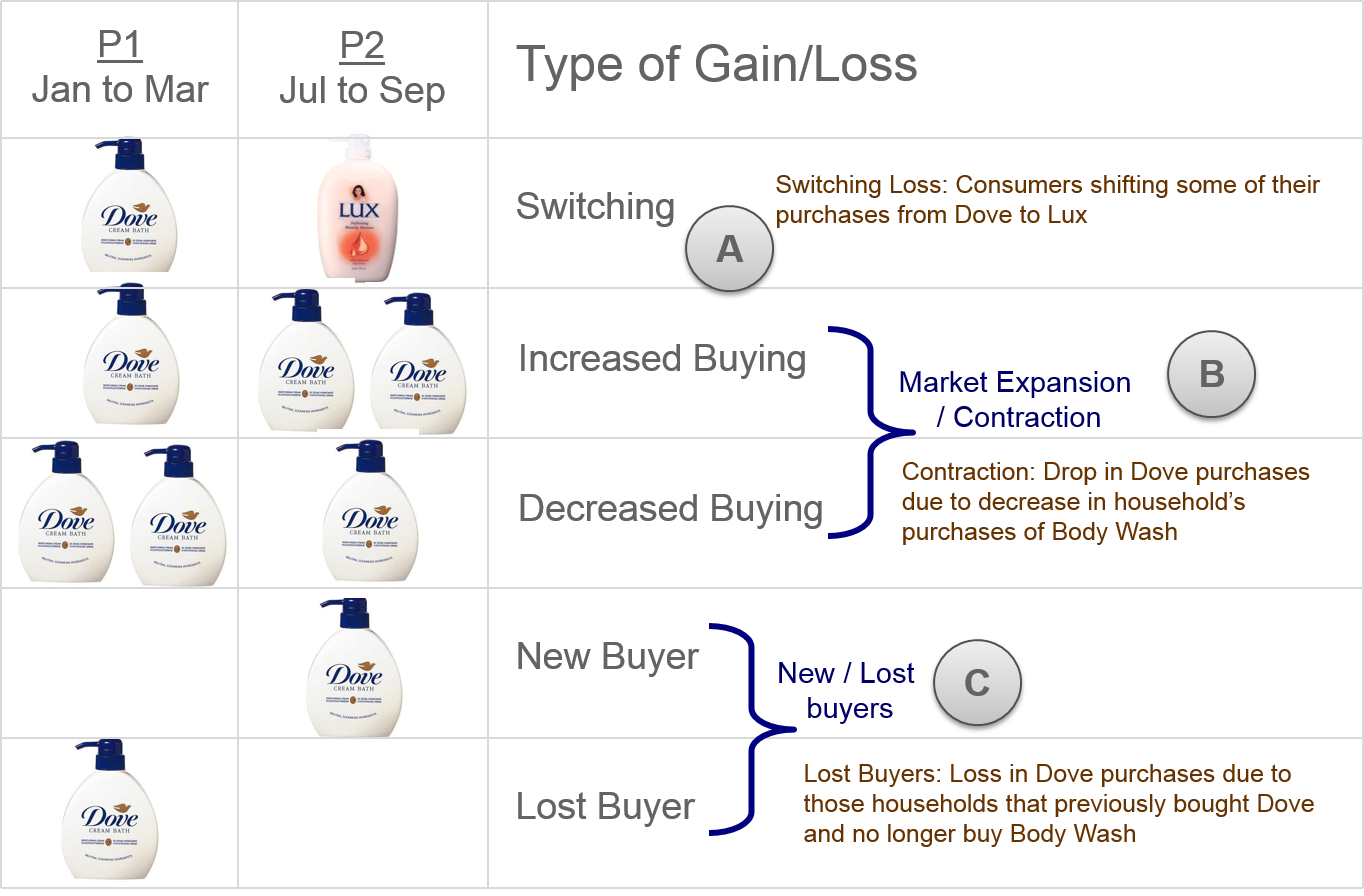
Types of Gains and Losses
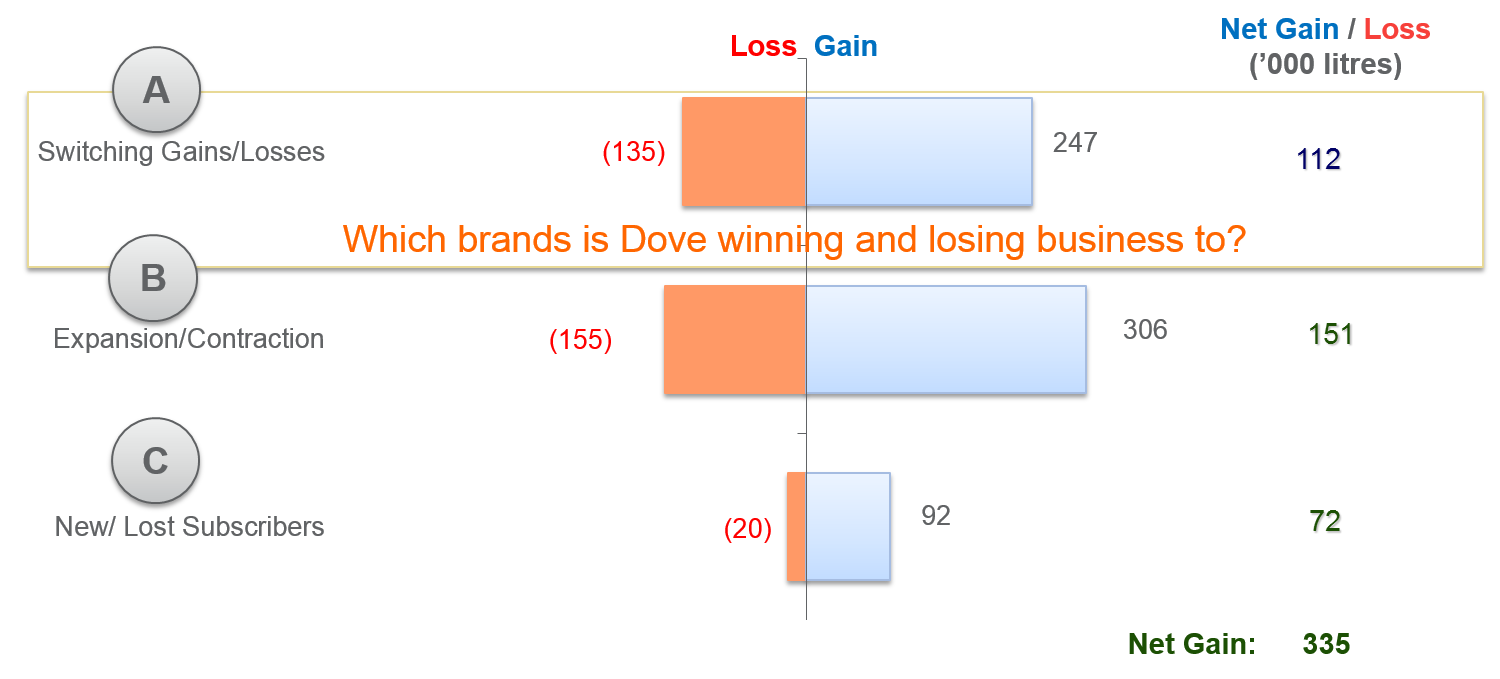
Exhibit 7.18 Analysis summary of gains and losses for Dove (Year 2 versus Year 1) (Fictitious data for illustration only).
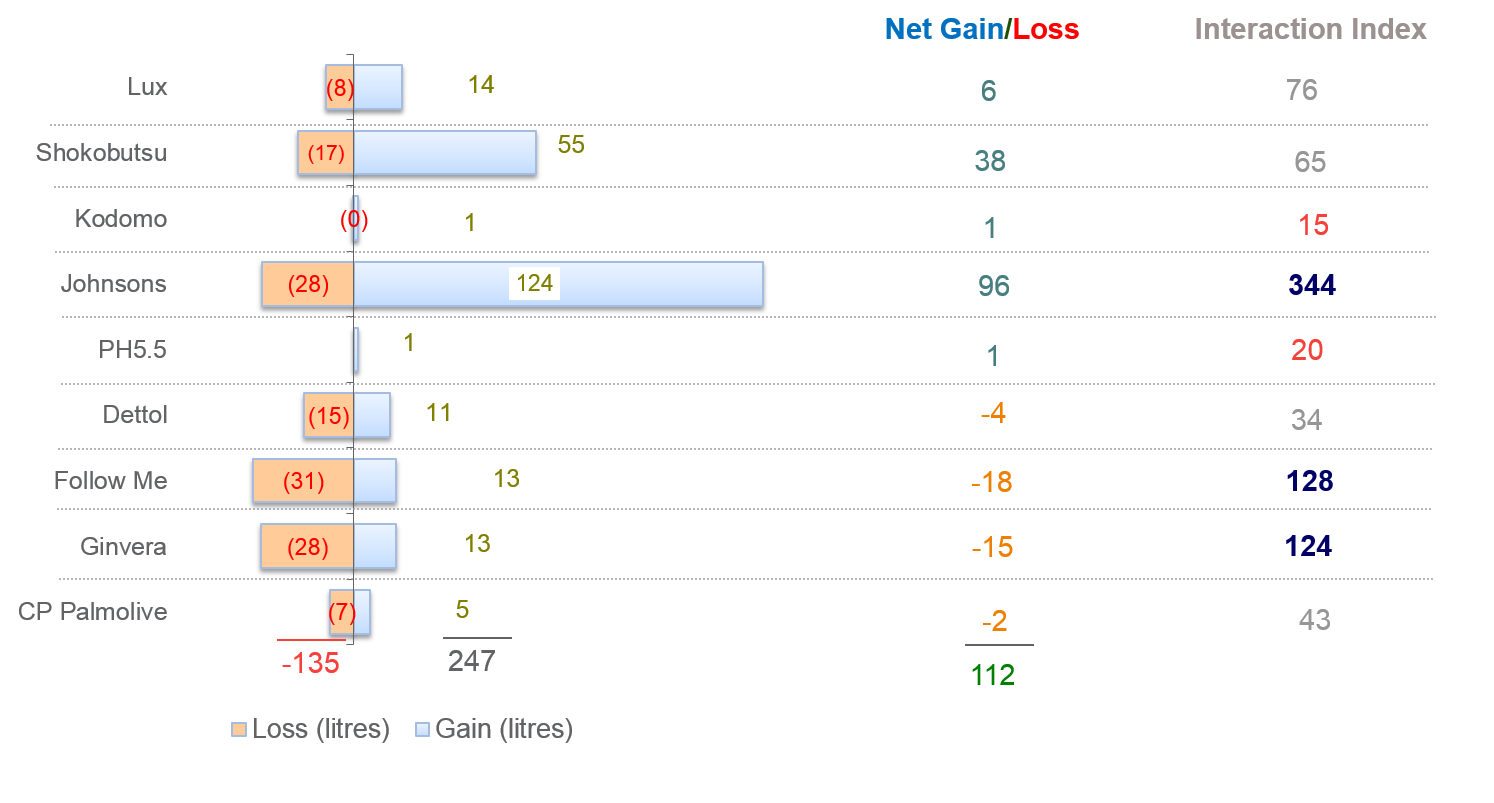
Exhibit 7.19 Analysis for Dove of gains and losses across brands (Year 2 versus Year 1).
Click to view demo.
Gain–loss reveals the source of growth and decline in a product’s sales over two time periods of equal length, in terms of the following:
- New/Lost category buyers
- Increased/Decreased category buying
- Brand Switching
Exhibit 7.17 depicts the different types of gains and losses. Observe that time period P1 (before) is equal in length to time period P2 (after), but the periods in this case are not adjoining one another. The analyst might be interested in assessing the impact of an initiative that occurred in Jan-Mar, after an interval of 3 months, when the fluctuations induced by the initiative settle down. External factors such as seasonality need to be considered when analysing gain–loss results. In most instances it is preferable that the pre and post periods (P1 and P2) fall within the same season.
Exhibit 7.18 provides an output of the gain–loss analysis for Dove body wash. It tells us that:
- Dove gains a total of 335,000 L in Year 2 over the previous year.
- 112,000 L is the net volume Dove gained from other brands. Households where Dove gained volume from competing brands contributed +247,000 L, and those where Dove lost volume to competing brands contributed −135,000 L.
- Dove gained 306,000 L from homes that increased purchases of body wash and lost 155,000 L to those homes that decreased purchase of body wash.
- Homes that bought body wash in Year 2 but not in Year 1, added 92,000 L to Dove’s sales. Lapsed body wash buyers accounted for a decline of 20,000 L for Dove.
Exhibit 7.19 zooms into the brand switching behaviour, providing a break-up across brands of the 247,000 litres gained and the 135,000 litres lost due to switching. For instance, if we consider Johnson’s, Dove gained 124,000 litres in those homes where consumers shifted purchases from Johnson’s to Dove, and Dove lost 28,000 litres in those homes where consumers shifted purchases from Dove to Johnson’s.
Interaction Index
Interaction index for a pair of brands, is a measure of the extent they interact in terms of the shifts in consumer purchases from one brand to the other. The norm is 100. If the index is above 115, the interaction is significantly above expectation, and if the index is below 85, the interaction is significantly below expectation. The interaction index of 344 between Dove and Johnson’s indicates that the propensity of Dove to interact with Johnson’s is 3.44 times greater than its fair share.
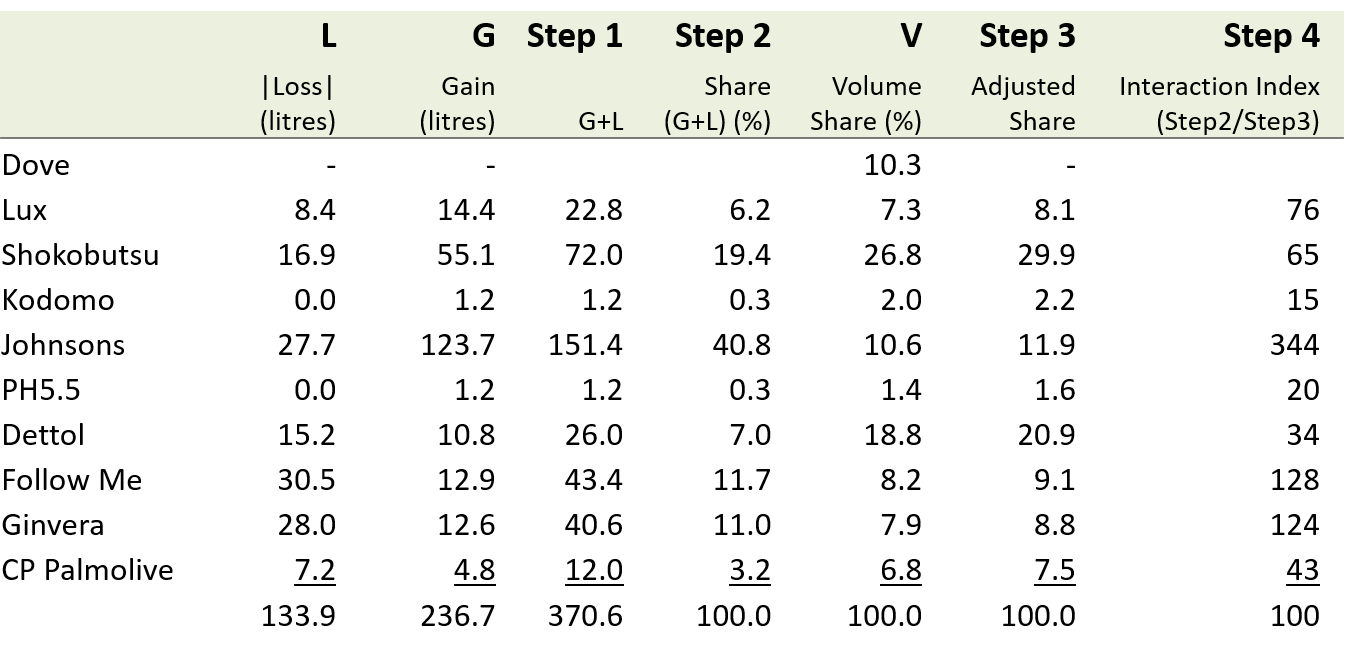
The index is computed as follows (refer to Exhibit 7.20):
- Step 1: Compute the total volume transacted (Gain + |Loss|).
- Step 2: Compute share of volume transacted.
- Step 3: Compute adjusted volume share after deducting Dove. $$ Adjusted\;Share = \frac{V}{100 -10.3} $$ (Where 10.3% is Dove’s volume share, and the volume share, V, is obtained from the panel data).
- Step 4: $$ Interaction\;Index = \frac{Share\;of\;Interaction}{Adjusted\;Volume\;Share} = \frac{Step\;2}{Step\;3} $$
The standard gain–loss algorithm assumes proportionate allocation of losses to gains — i.e., losses incurred by brands that lost volume are proportionately allocated to those brands that gained volume. This underestimates interaction between brands that compete strongly, and overestimates the interaction between brands that do not compete strongly. Alternative methods, nested gain–loss and hierarchical gain–loss, limit the bias, when interpreting gain–loss results, do remain aware of the method’s strengths and limitations.
The standard gain–loss algorithm assumes proportionate allocation of losses to gains — i.e., losses incurred by brands that lost volume are proportionately allocated to those brands that gained volume. This underestimates interaction between brands that strongly compete and overestimates the interaction between brands that do not directly compete.
Superior alternative methods, nested gain–loss and hierarchical gain–loss, are described in Appendix — Gain–loss Algorithms in The Marketing Analytics Practitioners Guide. However, these methods also suffer some limitations. It is important, therefore, when interpreting gain–loss results, to remain aware of the method’s strengths and weaknesses, which are outlined in the appendix.
Previous Next
Use the Search Bar to find content on MarketingMind.


Contact | Privacy Statement | Disclaimer: Opinions and views expressed on www.ashokcharan.com are the author’s personal views, and do not represent the official views of the National University of Singapore (NUS) or the NUS Business School | © Copyright 2013-2026 www.ashokcharan.com. All Rights Reserved.