Repeat Decay Curve
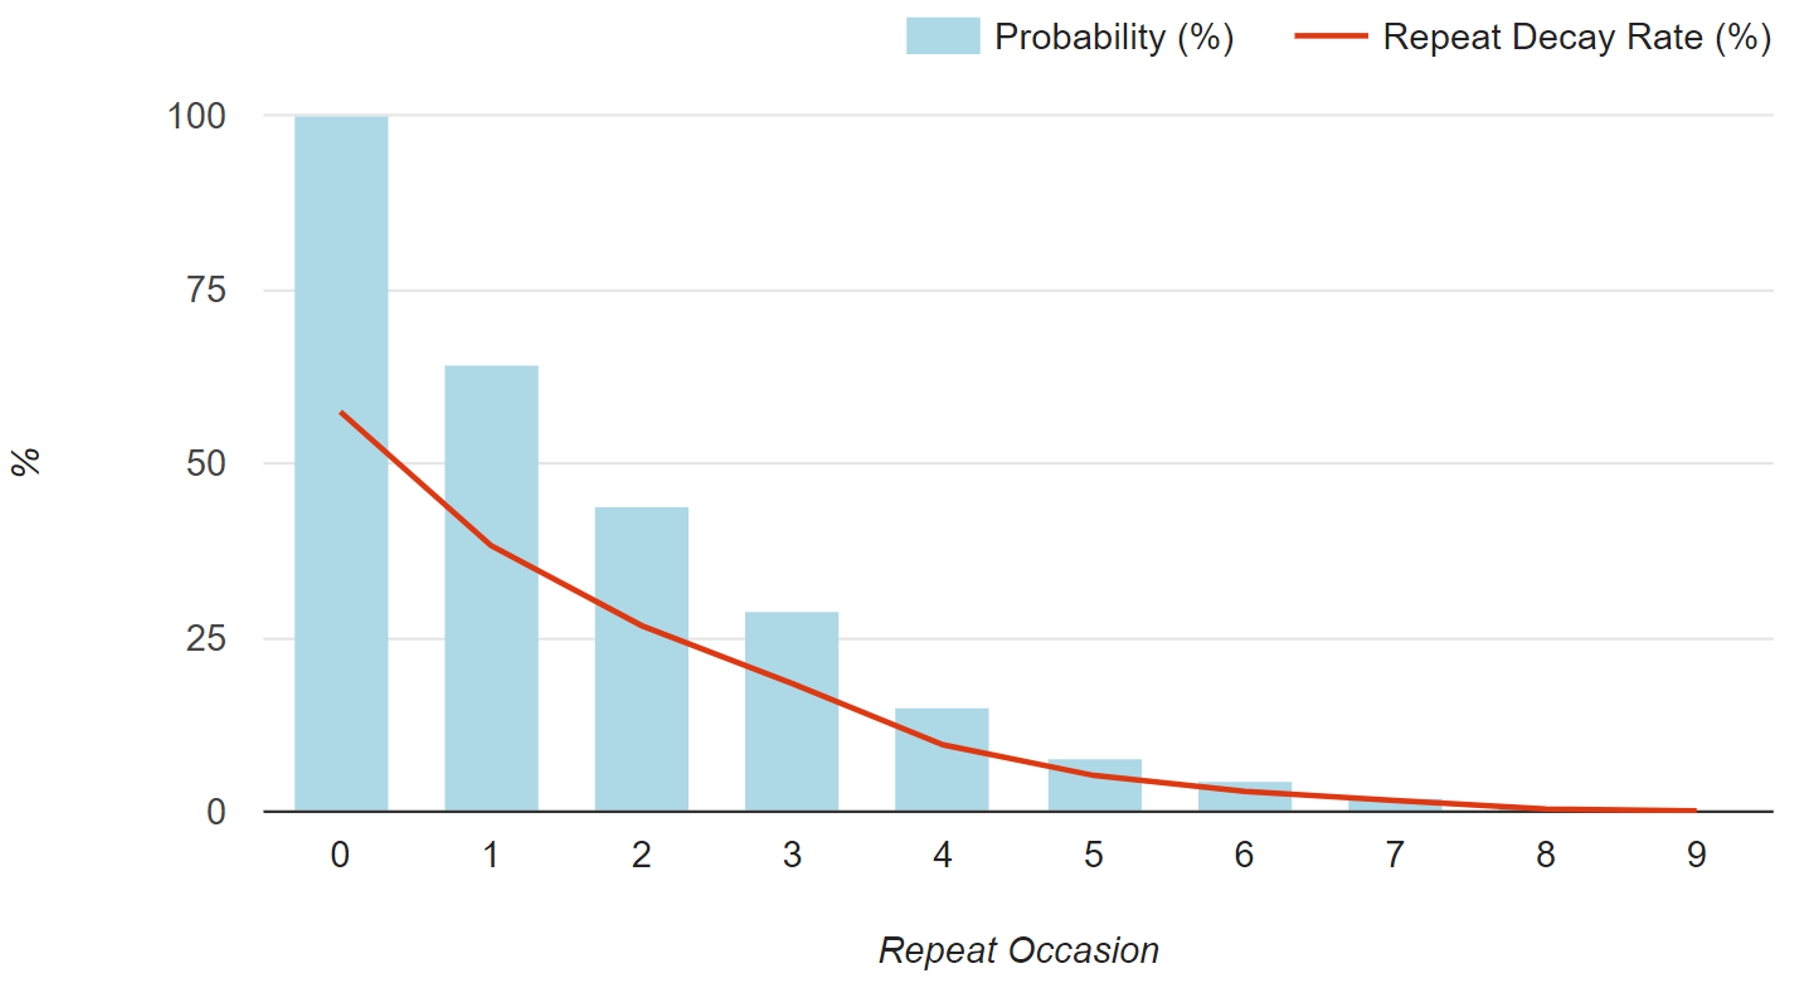
Exhibit 7.13 Repeat decay
analysis depicts the proportion (probability %) of buyers who repeat purchased at least
once, twice, thrice and so on, and their repeat decay rate.
The repeat decay analysis in Exhibit 7.13 depicts the proportion (probability)
of buyers who repeat purchased at least once, twice, thrice and so on, and their repeat
decay rate.
Computed as proportion who repeat purchased (probability) × brand loyalty, the repeat decay represents declining
sales contribution across repeat occasions, over a time horizon.
Comparing repeat decay curves over different time horizons, and across brands,
imparts an understanding of brand health. Brands that command greater loyalty decay at a
slower pace, across repeat occasions.


