
-
Product Validation
Product Validation
Moments of Truth
Launch Validation Methods
Simulated Test Markets
BASES
Controlled Store Test
Product Launch Evaluation
Parfitt-Collins Model
TRB Model
Bass Diffusion Model
- New Product Development
- Product Design
- Product Validation
- Marketing Education
- Is Marketing Education Fluffy and Weak?
- How to Choose the Right Marketing Simulator
- Self-Learners: Experiential Learning to Adapt to the New Age of Marketing
- Negotiation Skills Training for Retailers, Marketers, Trade Marketers and Category Managers
- Simulators becoming essential Training Platforms
- What they SHOULD TEACH at Business Schools
- Experiential Learning through Marketing Simulators
-
MarketingMind
Product Validation
Product Validation
Moments of Truth
Launch Validation Methods
Simulated Test Markets
BASES
Controlled Store Test
Product Launch Evaluation
Parfitt-Collins Model
TRB Model
Bass Diffusion Model
- New Product Development
- Product Design
- Product Validation
- Marketing Education
- Is Marketing Education Fluffy and Weak?
- How to Choose the Right Marketing Simulator
- Self-Learners: Experiential Learning to Adapt to the New Age of Marketing
- Negotiation Skills Training for Retailers, Marketers, Trade Marketers and Category Managers
- Simulators becoming essential Training Platforms
- What they SHOULD TEACH at Business Schools
- Experiential Learning through Marketing Simulators
TRB Share Prediction Model
Numerous studies on new product launches across a range of FMCG categories including personal wash, fabric cleaning, toothpaste, hot beverage categories and infant milk, were conducted by the author with Hindustan Unilever’s consumer panel data in 1990-94, and more recently with FairPrice (Singapore) supermarket’s loyalty card data. Market share prediction for the new products was based on the notion of trial and repeat purchase that forms the basis of most product validation models. The outcome was a refined version of the Parfitt-Collins technique, which I simply called the TRB model.
The TRB model is a consumer/loyalty panel based technique for predicting a new product’s expected market share soon after it is launched.
Market share is a variable, and in an ever-changing environment it constantly fluctuates. These fluctuations are more pronounced particularly during the launch of a product when consumers are trying out the product, and manufacturers are strongly promoting it. It usually takes more than a year for the sales baseline to stabilize, fluctuating over a narrower bandwidth. The TRB model’s share prediction pertains to new product’s expected market share when this relatively stable state occurs.
The model decomposes a new product’s sales in terms of fundamental growth drivers — trial and repeat purchase. These drivers which reveal consumers’ desire to try the brand and their willingness to continue buying after experiencing it, reflect the brand’s ability to succeed at the FMOT and the SMOT.
Trial and Repeat Purchase
The success of a new product hinges on its moments of truth. Only by building a loyal consumer base of regular consumers, who continue to buy the product after trying it, can the product truly thrive.
Success at the FMOT can be gauged by the trial rate, the proportion of consumers who try the new product. It reflects the attractiveness of the new product concept, how effectively it is communicated, and how well the brand is positioned. The trial rate is also strongly influenced by causal factors such as distribution, promotions and sampling.
Success at the SMOT depends on whether consumers’ experiences with the product evoke the desire to continue buying it. It is a function of the extent to which the new product lives up to or exceeds expectations.
Trial Index
$$ Trial\,Index = \frac{Trial\,Rate\,(Product)}{Trial\,Rate\,(Category)} $$Where:
Trial Rate (Product) is Projected Penetration (Cumulative) of new product.
Trial Rate (Category) is Projected Penetration (Cumulative) of category over the same period.
The trial index reflects the first moment of truth and is dependent on:
- The product concept (inclusive of price) and its communication through advertising and packaging.
- Product distribution.
- Consumer promotions, including sampling.
Repeat Buying Rate (RBR)
The RBR is a measure of the propensity of consumers to continue buying a product. In terms of definition, RBR(t) is the brand’s share among those who repeat purchased the brand t periods (usually the time period is in months) after they first tried it. RBR (5) = 15% means that for the average trialist, the new product constitutes 15% of purchases of the product category, on the 5th interval after trial.
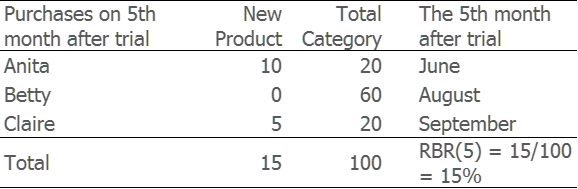
Exhibit 11.17 Illustration of RBR: Purchases by three consumers on the fifth month after they first tried the brand.
Exhibit 11.17 illustrates how RBR is computed. It depicts three trialists of a new product: Anita, Betty and Claire. Anita bought the new product in January, Betty in March and Claire in April. The fifth interval after trial is June for Anita, August for Betty and September for Claire. On their respective fifth interval, Anita bought 10 units of the new product and 20 units of the category, Betty bought zero units of the new product and 60 units of the category, and Claire bought 5 units of the new product and 20 units of the category. Their total purchases of the new product (10 + 0 + 5) as a proportion of the total purchases of category (20 + 60 + 20) equals 15%, which by definition is RBR(5).
Note that RBR computation is based on all those who ever tried the new product, which includes current as well as lapsed buyers. Betty, for instance, is a lapsed buyer.
The trialists are split into cohorts based on the month they first tried the new product, and RBR is measured over each purchase occasion after trial. So there exists a whole series of RBRs. RBR(1) is the RBR value at first purchase interval after trial, RBR(2) pertains to the 2nd purchase interval, RBR(3) to the 3rd and so on.
As novelty wears off, the level of interest in a new product is likely to diminish. Promotions and advertising which peak during launch, decline thereafter. With fatigue setting in, RBR tends to decline before it stabilizes. RBR(1) is usually higher than the other RBRs, followed by RBR(2), RBR(3) and so on. Yet the rate of decline rapidly decelerates and RBR values stabilize after the first few intervals, for successful new products. This stable value of the RBR is a measure of consumers’ willingness to continue buying a brand. It is the parameter in the TRB model that usually has the greatest bearing on the success of the new product.
Buying Index
Trial × RBR is a fair approximation of a product’s expected market share, with the exception that it assumes that consumers purchasing the new product will acquire the same amount of the category as the typical category purchaser. To factor the heaviness of buying of the category by consumers of the new product, the TRB model introduces a third parameter, the buying index:
$$ Buying\,Index = \frac{Category\,Consumption\,by\,Brand\,Repeaters}{Category\,Consumption\,by\,All\,Category\,Buyers} $$where Category Consumption is the average category volume purchased per buyer.
As can be seen from the above equation, this index of the heaviness of buying of the product category by the new brand’s repeat buyers is the ratio of purchases of category by the brand’s repeat buyers over the purchases of category by all category buyers.
If, for instance, the buying index is 1.25, it tells us that the average repeat buyer of the brand buys 25% more of the category than the average category buyer. And, if it is 0.95, then the brand repeat buyers buy 5% less on average than category buyers.
The Model
Market Share = Trial Index × RBR × Buying Index
Provided the sample size is adequate and market dynamics do not change, the forecast provides a reliable estimate of the brand’s baseline market share. However, since dynamics do tend to change, if panel data is readily accessible, marketers should continue to periodically revise estimates of a new product’s market share over the first year or two of launch.
For categories with short inter-purchase intervals such as bread and fresh milk that are bought on a weekly basis, the TRB model performs optimally and can provide forecasts within a few weeks after launch. Additionally, the model is effective for products with monthly or quarterly purchase cycles, such as most packaged foods and personal care items. However, it is not advisable to use the model for products that are infrequently bought again.
Diagnostics
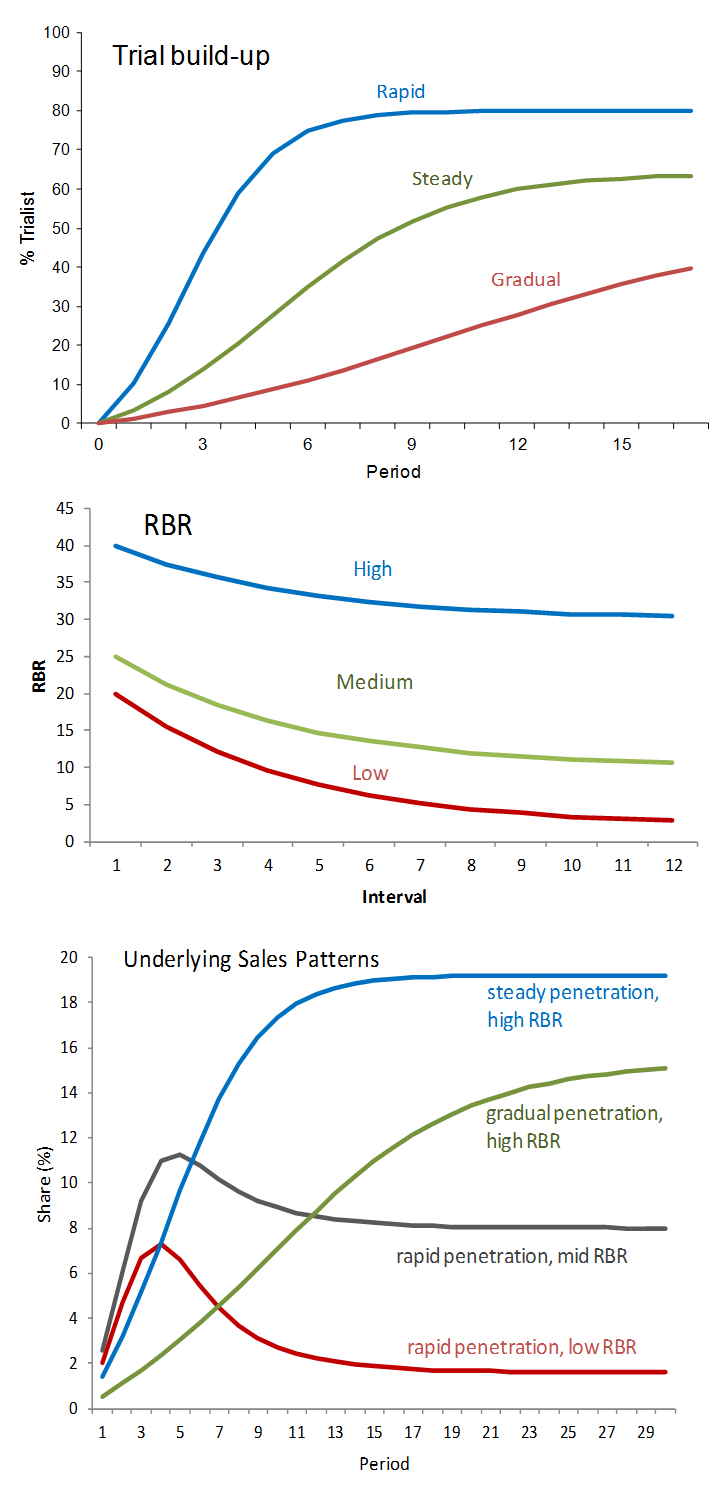
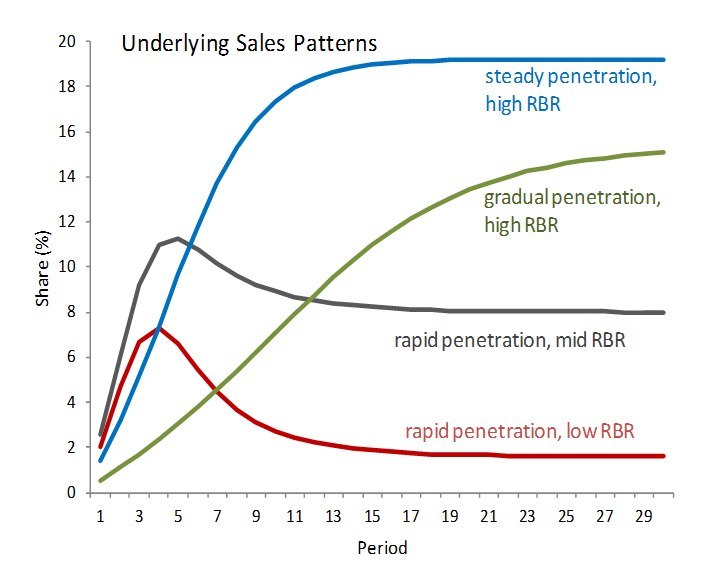
Exhibit 11.17 illustrates the fundamental trends in trial, RBR, and sales growth. Sales patterns fluctuate based on RBR and penetration growth, and there is frequently a kink or hump during the initial year of introduction. These varied and sometimes alternating patterns demonstrate why initial sales data is an insufficient indicator of the new product's potential market share. Additionally, sales data can be influenced by other factors such as promotions and advertising.
The enduring success of a product is mainly determined by RBR, making it a crucial factor. If a product has low RBR, marketers must conduct customized research to identify the reasons why consumers are not repurchasing. Enhancing RBR usually entails refining the product or changing other elements of the marketing mix.
If RBR meets or exceeds expectations, but sales are restricted by low trial rates, marketers can employ various promotional strategies such as sampling, price discounts, and product displays to induce trial. Additionally, they need to evaluate the product proposition and the communication strategy to determine why target consumers do not find the product appealing enough to try it.
Although well-executed promotions yield substantial gains in trial rates, which are critical during the initial adoption phase of a new product, their long-term impact is trimmed by a drop in RBR. Consumers who try the new product solely due to promotions are less inclined to repurchase it compared to those who purchase it without any promotion. Therefore, the long-term share gains resulting from the increase in penetration are slightly lowered by the decline in RBR.
For a comprehensive evaluation of their new product launch, in addition to tracking trial and repeat buying rates, and forecasting market share, marketers should analyse buying behaviours through other consumer analytics techniques such as overlap analysis and gain–loss analysis.
The gain–loss analysis provides insights into the sources of growth of the new product. Of particular interest is the extent that the new product is cannibalizing sales from the company’s other products.
Previous Next
Use the Search Bar to find content on MarketingMind.


Contact | Privacy Statement | Disclaimer: Opinions and views expressed on www.ashokcharan.com are the author’s personal views, and do not represent the official views of the National University of Singapore (NUS) or the NUS Business School | © Copyright 2013-2026 www.ashokcharan.com. All Rights Reserved.