
-
Product Validation
Product Validation
Moments of Truth
Launch Validation Methods
Simulated Test Markets
BASES
Controlled Store Test
Product Launch Evaluation
Parfitt-Collins Model
TRB Model
Bass Diffusion Model
- New Product Development
- Product Design
- Product Validation
- Marketing Education
- Is Marketing Education Fluffy and Weak?
- How to Choose the Right Marketing Simulator
- Self-Learners: Experiential Learning to Adapt to the New Age of Marketing
- Negotiation Skills Training for Retailers, Marketers, Trade Marketers and Category Managers
- Simulators becoming essential Training Platforms
- What they SHOULD TEACH at Business Schools
- Experiential Learning through Marketing Simulators
-
MarketingMind
Product Validation
Product Validation
Moments of Truth
Launch Validation Methods
Simulated Test Markets
BASES
Controlled Store Test
Product Launch Evaluation
Parfitt-Collins Model
TRB Model
Bass Diffusion Model
- New Product Development
- Product Design
- Product Validation
- Marketing Education
- Is Marketing Education Fluffy and Weak?
- How to Choose the Right Marketing Simulator
- Self-Learners: Experiential Learning to Adapt to the New Age of Marketing
- Negotiation Skills Training for Retailers, Marketers, Trade Marketers and Category Managers
- Simulators becoming essential Training Platforms
- What they SHOULD TEACH at Business Schools
- Experiential Learning through Marketing Simulators
The Bass Diffusion Model
The TRB Share Prediction model is best suited for FMCG products where adoption of products is reflected in consumers’ willingness to continue buying. For these products the development of brand loyalty through repeat purchases is the measure of the success of a brand, and this is a function of RBR and trial rate.
In the case of products like consumer durables that are infrequently purchased, trial is a reflection of adoption. For such products, where the consumer’s inter-purchase interval extends into years, innovation diffusion models may be used to predict sales.
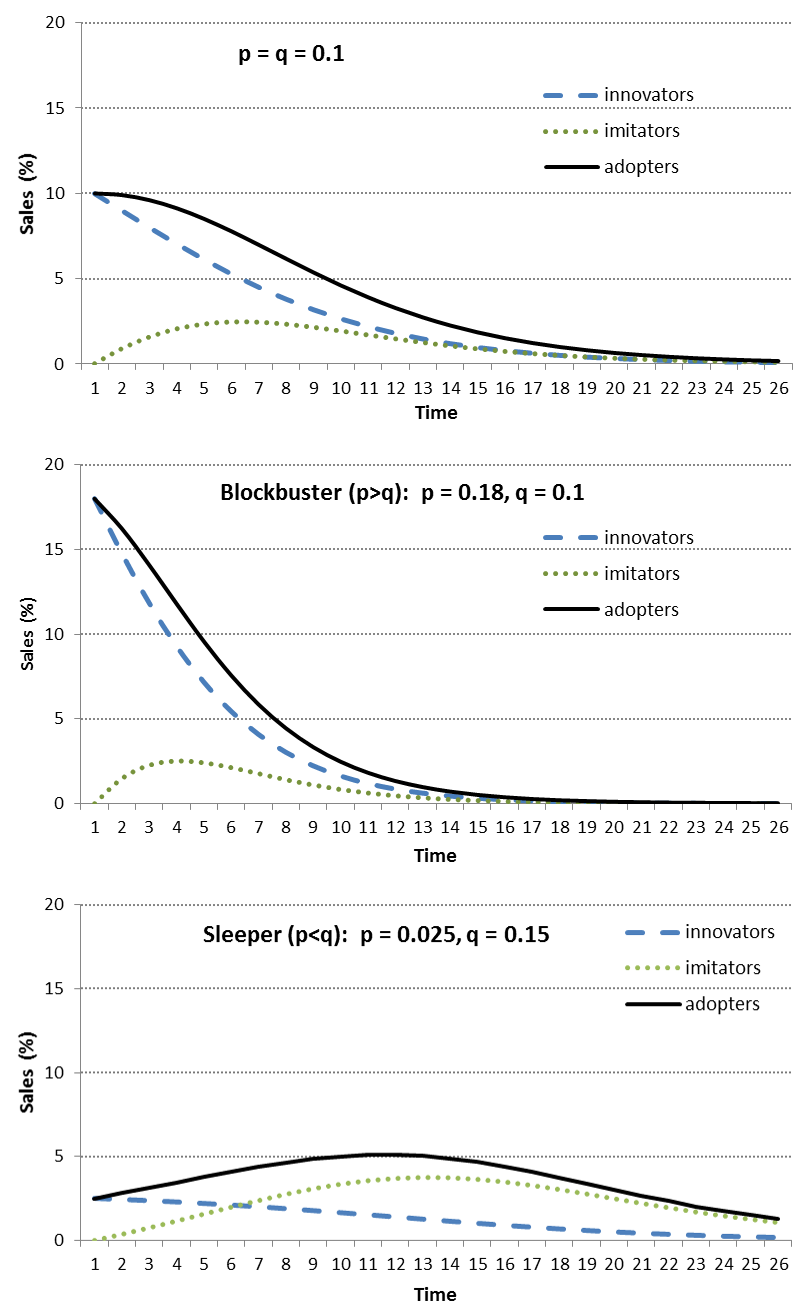
The Bass diffusion model is one of the most thoroughly researched models in market forecasting. Published in 1969, the model has proven to be versatile in representing the different patterns of adoption of products — from “sleepers”, where the sales pick up is gradual, to the “blockbusters”. It works well for a very wide range of categories and application fields within sectors like consumer durables, computers and technology products, medicine and medical services, agricultural innovations and services, prestige personal care, movies, books and so on.
The underlying assumption is that adoption by potential customers is triggered by two types of behaviour: innovation and imitation. “Innovation” is driven via influences such as advertising that are not dependent on the decisions of others in the social system. Its impact is more pronounced during the early stages of the product life cycle. “Imitation” is the influence of prior adopters through positive word-of-mouth.
The model further assumes:
- Maximum number of potential adopters or buyers is fixed.
- All potential adopters eventually purchase.
- Repeat purchases are not accounted for.
The basic model is represented by the following equations:
$$ n(t)=adopters\,via\,innovation+adopters\,via\,imitation$$ $$ adopters\,via\,innovation=p\times remaining\,potential = p[M-N(t)]$$ $$ adopters\,via\,imitation=q\times proportion\,of\,adopters \times remaining\,potential$$ $$ \qquad = q\frac{N(t)}{M}[M-N(t)]$$ $$ Equation \,1: \mathbf{n(t)= p[M-N(t)]+q\frac{N(t)}{M}[M-N(t)]}$$Where:
n(t) = number of adopters at time t measured in years.
N(t) = n(0) + n(1) + n(2) ... n(t).
M = total number of potential adopters.
p = coefficient of innovation.
q = coefficient of immitation.
Exhibit 11.18 provides a comparison of the adoption trajectories for different values of p and q. If q > p, as is normally the case for most innovations, then imitation behaviour dominates, and the plot of sales over time will resemble a bell shape. On the other hand, if q <= p, as is the case for blockbuster products, then sales peak at introduction and decline in every subsequent time period.
Model Calibration
The model representation (Equation 1) is essentially of the form:
$$ X_i=a+bY_i+cY_i^2 $$ $$ where \, a=pM, \,b=q-p \,\, and\,\, c=-q/M $$If the innovation has been marketed, estimates of p, q and M from historical sales data may be obtained using a variety of statistical methods applicable for the above functional form. Of these the nonlinear least square method is known to yield better predictions, whereas the ordinary least squares linear regression is the easiest to work with.
If no sales data is available for the innovation, the parameters may be sourced from the diffusion patterns of product categories that exhibited similar characteristics when they were adopted. Estimates of coefficients p and q, for a wide range of product categories are readily available among a host of research publications. Based on a compilation provided in the text Principles of Marketing Engineering (Lilien et al., 2013) the average value across a wide range of products is 0.035 for the coefficient of innovation, and 0.390 for the coefficient of imitation. The book provides industry specific data for agricultural, consumer electronics, appliances, information technology, medical fields and a range of other products and services.
Limitations and Extensions
The assumptions inherent within the model and the inputs that it relies on, give rise to a number of limitations and model extensions including the following:
- The basic Bass model works best for sales patterns that resemble the forms shown in Exhibit 11.18. This may apply for yearly data but is rarely valid for monthly or quarterly sales data which fluctuates due to causal factors like promotions and advertising.
- Calibration based on sales data may be too late for most firms, and this is particularly true for yearly sales data because big investments in the product would already have been made.
- While the use of analogous category may permit forecasting at earlier stages of product development, the choice of category is crucial. Importantly historical data mostly relates to successful innovations. This bias will result in favourable predictions for new innovations, unless some adjustment is made to factor the probability of failure, which is tricky because data for analogous innovations that failed is often not readily available.
- A prime forecasting objective for marketers is to assess the potential market of a product. Where sales data is not available, the model’s reliance on other sources (based on alternative research methods like Delphi or management’s intuition), dilutes its utility.
- The basic model assumes that market potential is fixed. This is not true because elements of the marketing mix such as price, advertising, distribution and product keep changing. Extensions to the model allow for the incorporation of the effects of marketing mix variables, especially price, advertising and sales efforts, on the likelihood of adoption.
- Another extension to the model allows for variation in the coefficient of imitation over time. The impact of word-of-mouth is expected to vary during different stages of the product’s life cycle.
- The model is also extended to allow for repeat or replacement purchases.
- Considering that product life cycles have shrunk over the years, and new technologies cannibalize or supersede the old at a faster pace, the validity of the Bass forecast would be limited in duration.
In summary, the Bass diffusion model is a conceptually appealing model that has been extensively researched. Academics have added numerous extensions enhancing the application and accuracy of the model in predicting the diffusion of innovations for categories where repeat purchases occur after many years. A key limitation however is that accurate estimation of the potential of an innovation usually requires a few years of sales data, by which time key investments would already have been made.
Previous
Use the Search Bar to find content on MarketingMind.


Contact | Privacy Statement | Disclaimer: Opinions and views expressed on www.ashokcharan.com are the author’s personal views, and do not represent the official views of the National University of Singapore (NUS) or the NUS Business School | © Copyright 2013-2026 www.ashokcharan.com. All Rights Reserved.