As the name suggests, Controlled
Store Test (CST) is a test conducted in-store to assess the potential of an
initiative, usually in relation to a new product. It is appealing because of its
real-world setting — from the standpoint of a new product launch, the store
shelf is the point where the consumers’ initial encounters with the product
culminate into the act of buying it.
Applications
CST is particularly useful for
fine-tuning elements of the mix, for example:
- Special displays and promotions: Determine which type of
displays, promotions, in-store sampling and in-store media work
best for the brand.
- Merchandising: Assess the impact on shelf allocation of
arrangement such as brands stocked vertically or horizontally.
- Pricing: Evaluation of different price points, types of packaging, product
line mix and extensions.
Note that unless a CST is supported with disaggregate transaction
data, such as loyalty panel data, that reveals trial and repeat purchase, it does not
predict a new product’s expected sales or market share. It only reveals
the product’s share over the duration of the test. Since it takes 6 to 12 months for
sales of FMCG products to stabilize, CST is not suited for predicting market share of
these products.
Methodology

Exhibit 11.11 Matched panel approach: control and test panels.
An important prerequisite
is the cooperation of one or more retailers as their stores are deployed
for test purposes. Their support is crucial to the success of the research programme.
CST methods require controls in place — stock outs
and unintended in-store activities that influence sales are not admissible. For
a new product, in-store media such as shelf talkers or
floor vision will be required to convey the new product’s positioning.
CST is essentially a form of A/B Testing.
The matched panel CST is
a commonly used approach that requires two matched panels of stores: Control
panel and Test panel (refer to Exhibit 11.11). The test panel is where changes to the mix are
introduced, whereas the control panel is insulated from these changes. The two
panels are matched on a range of criteria including:
- Store size
- Category turnover
- Product range
- Strength of test brand
- Historical trend
- Shopper demographics
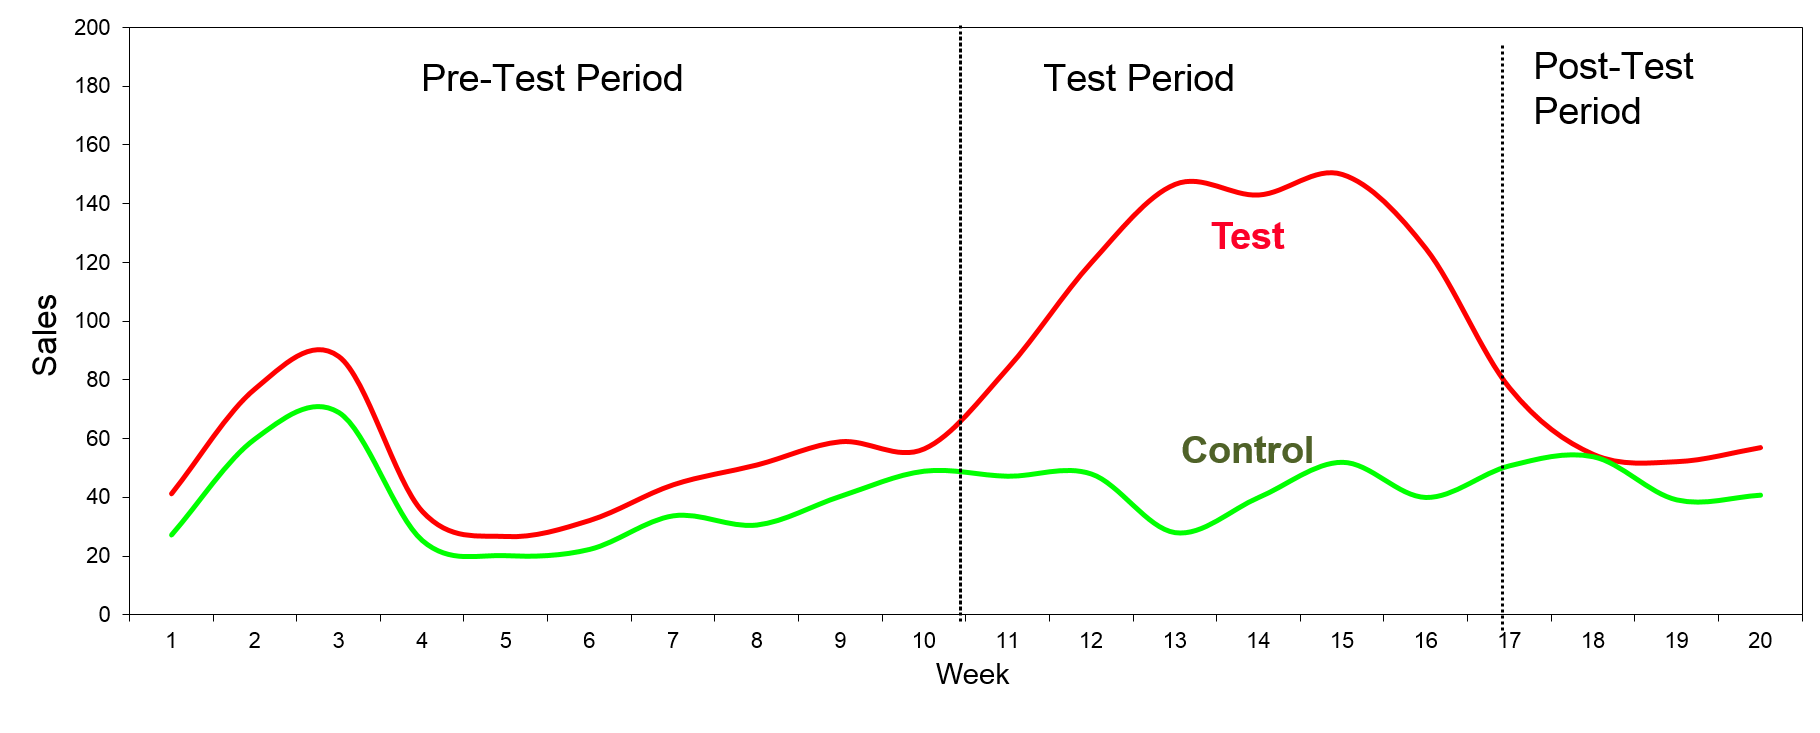
Exhibit 11.12 Analysis of matched panels.
| Average Sales per week | Control Panel | Test Panel |
|---|
| Pre-Test | 37.8 | 51.1 |
|---|
| Test phase | 42.5 | 128.1 |
|---|
| Post-Test | 46.2 | 60.3 |
|---|
| Sales Index | | |
|---|
| Pre-Test | 100 | 100 |
|---|
| Test phase | 112.7 | 250.6 |
|---|
| Post-Test | 122.3 | 117.9 |
|---|
Exhibit 11.13 Sales summary for CST in Exhibit 11.12.
One advantage of matched panel is that it
compensates for seasonality and other environmental factors. Analysis is based
on sales trend comparison within the two panels, over a duration that covers
the test period and time intervals, before and after the test.
Hypothesis testing is used to analyse the
difference between the two panels and test their significance.
(Details of hypothesis testing and the determination of sample size are provided in
sections Hypothesis Testing and
Sample Size — Comparative Studies
in Chapters Basic Statistics and Sampling).
Consider for example the results of a CST depicted
in Exhibits 11.12 and 11.13. The special displays and in-store media activities
during the test period resulted in sales volume growth of 122% (250.6 over
112.7).
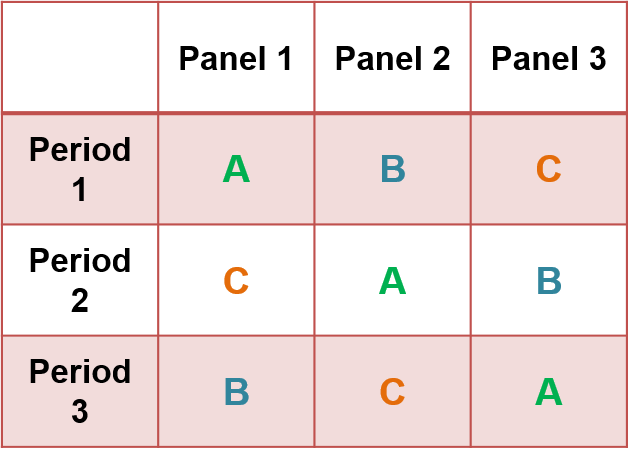
Exhibit 11.14 Example of Latin square for 3 different scenarios
to be tested, say price: A: $10, B: $12.50, C: $15.
Latin squares is
another approach to CST where an N × N table (see Exhibit 11.14) is
filled with N different scenarios in such a way that each scenario
occurs exactly once in each row (time period) and exactly once in each column
(panel of test stores). This approach permits simultaneous evaluation of
multiple scenarios. It compensates for seasonality as well as idiosyncrasies
across different groups of stores.
Case Example
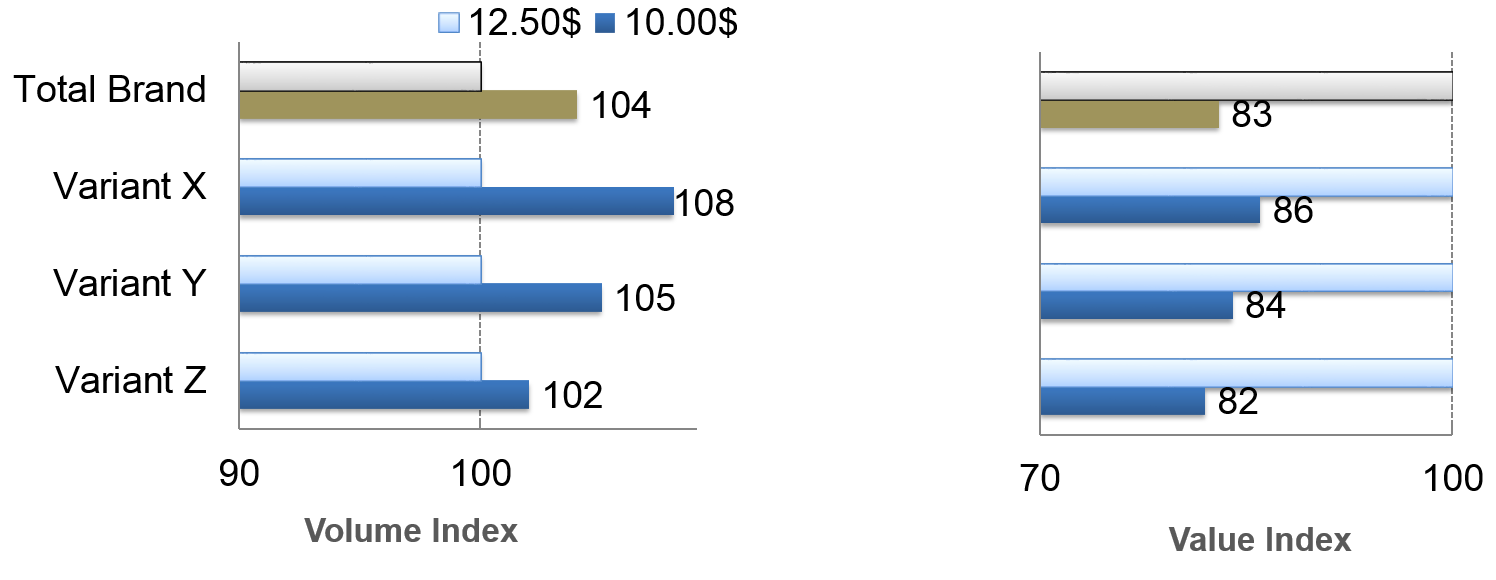
Exhibit 11.15 Case example: impact of a price reduction on sales
volume and value.
Objective: To measure impact
of price ($10.00, $12.50, $15.00) on sales volume and value of a shampoo
brand with variants X, Y and Z.
Methodology:
Latin Squares.
Analysis in Exhibit 11.15 reveals that this shampoo
brand is fairly inelastic. It gains a relatively small 4% in volume, and loses
17% in value, when price is dropped from $12.50 to $10.00, a 20% reduction.


