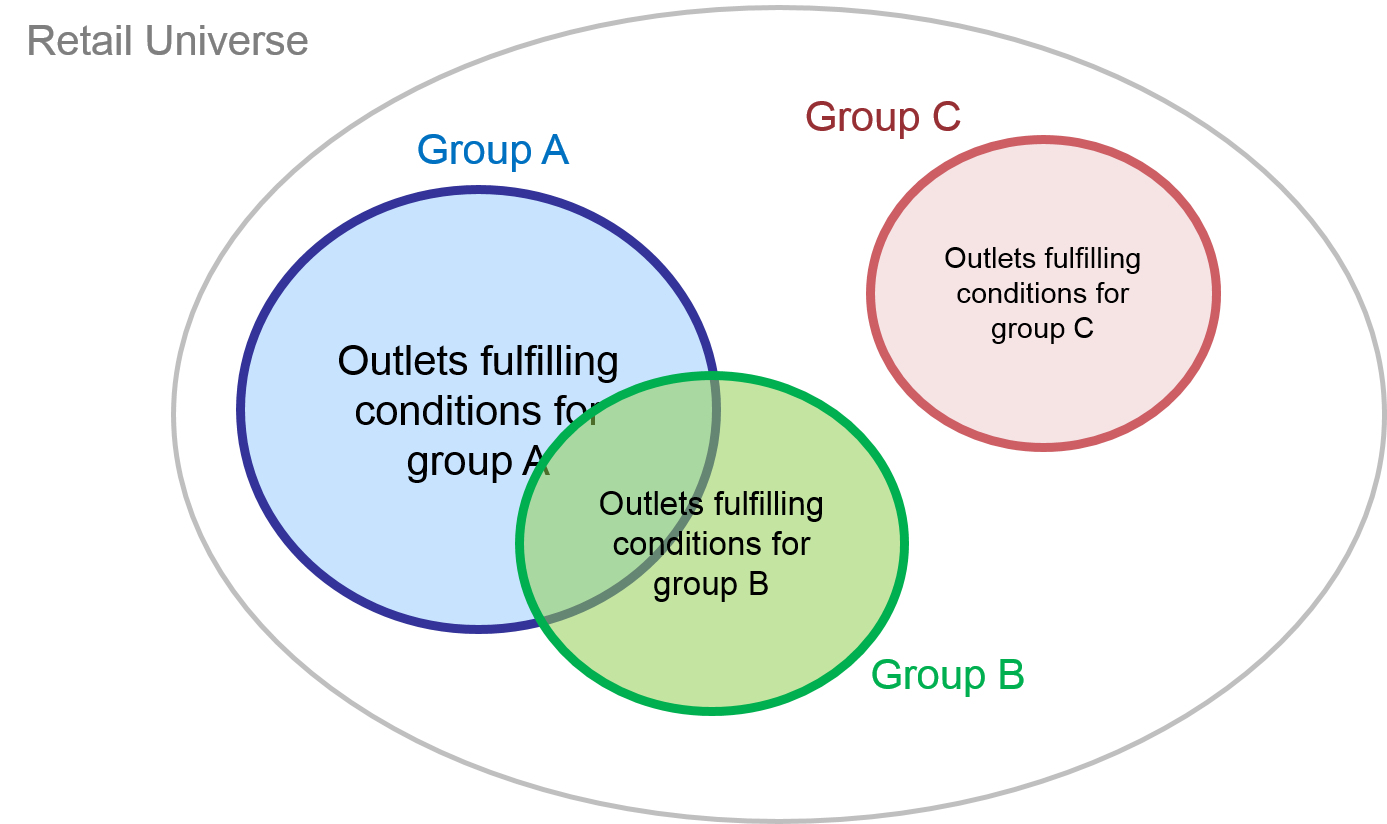
Exhibit 32.1 Forming outlet groups.
Retail analytics using retail tracking
databases involves filtering the data to form one or more outlet groups
(refer Exhibit 32.1). The groups may be defined based on the physical
characteristics of the outlets (e.g., location, size, type of outlet, type of
facilities etc.) or on the sale and distribution of products.
Outlet grouping serves the purpose of drilling into relevant data.
If a particular retail issue is to be evaluated, the groups are configured so
that they provide a deeper understand of that issue. For example:
- Handlers’ analysis: Outlets are filtered according to
whether they stock a product, or any combination of products.
- Assortment analysis: Outlets grouped according to assortment
criteria. For example, outlets that stock 1 or 2 models of Sony TVs, outlets that stock
3 to 6 models, and outlets that stock more than 6 models.
- Brand overlap: Groups based on overlapping distribution. For
example, outlets that sell Coca-Cola and not Pepsi, outlets that sell Pepsi and not
Coca-Cola, and outlets that sell both Coca-Cola and Pepsi.
- Shelf space analysis: For instance, outlets with less than
10% forward stock and outlets with more than 10% forward stock of an item or a
selection of items.
- Pricing: Filter outlets based on pricing criteria. The criteria
may also be comparative pricing, e.g., stores where Pantene shampoo is cheaper than
Sunsilk, and stores where it is more expensive than Sunsilk.
- Promotion: For example, petrol stations that promoted RON 92 fuel
and those that did not promote.
- Rate of sale: Group stores into criteria based on rate of sale,
e.g., outlets where rate of sales for category is heavy, versus outlets where it is
medium or light.