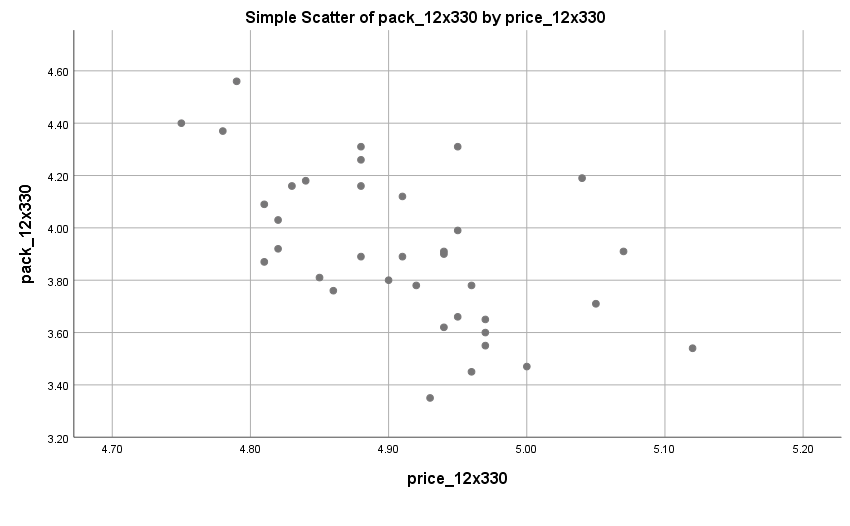
Exhibit 34.29 Scatterplot. (Source: SPSS).
Simple and multiple linear regression are linear by definition. Moreover, the
correlation measures that these techniques are based on, represent only the linear association
between variables.
Linearity may be visually examined via scatterplots such as the one shown in
Exhibit 34.29. Alternatively, for a more accurate assessment, you could run a simple
regression analysis and examine the pattern of residuals.
Nonlinear relationship can be made linear in parameters by transforming one or more
of the variables.
Common approaches include,for relatively flat distributions, the inverse
transformation 1/x or 1/y, and for positively skewed distributions distribution, square
root transformation:
$$x_{new}=\sqrt{x_{old}},$$
And log, for negatively skewed distribution:
$$x_{new}= log(x_{old}).$$
New variables may be created to represent the nonlinear portion of the relationship.
Polynomials (x2 or x3) for instance, are power
transformations of an independent variable that add a non-linear component:
- x1 (power = 1): linear.
- x2 (power = 2): quadratic. Single inflection point.
- x3 (power = 3): cubic. Two inflection points.
If the relationship is known to be nonlinear with inflection points, a common practice
is to start with the linear component, and then sequentially add higher-order polynomials till there
is no significant additional improvement in the fit (R2). The t-test would confirm whether
or not the additional terms are significant.


