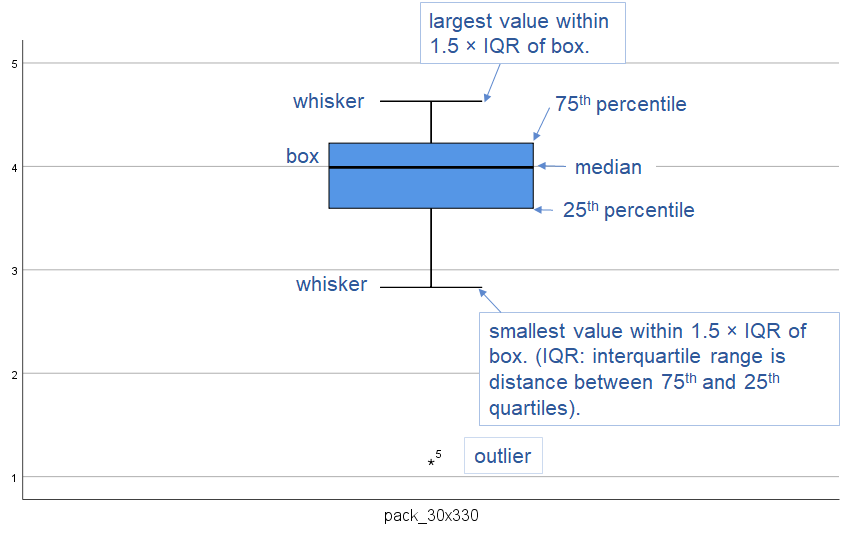
Exhibit 34.30 Box and Whiskers plot. This indicates whether distribution is skewed and reveals outliers, i.e., values lying beyond the whiskers (data point #5).
An outlier is an observation that is distant from other observations. It may
result from measurement error; in which case it should be discarded. Or it may be indicative of a
heavy-tailed population distribution, which then violates the assumption of normality.
Box and whisker plots such as the one shown in Exhibit 34.30, reveal outliers in
a univariate assessment. For pairs of variables, outliers appear as isolated points on the outskirts of
scatterplots. For more than 2 variables, statistical techniques such as Mahalanobis D2 may be used for
detecting outliers.
Influential observations are any observations, outliers included, that have a
disproportionate effect on the regression results. These need to be carefully examined and should be
removed, unless there is a rationale for retaining them.


