
-
Basic Statistics
Basic Statistics
Probability Theory
Mutually Exclusive Events and Overlapping Events
Objective and Subjective Probabilities
Conditional (Posterior) Probability
Independent Events
Law of Total Probabilities
Bayes Theorem
Discrete Probability Distribution
Binomial Distribution
Poisson Distribution
Relationship between Variables
Covariance and Correlation
Joint Probability Distribution
Sum of Random Variables
Correlation and Causation
Simpson’s Paradox
Continuous Probability Distributions
Uniform Distribution
Exponential Distribution
Normal Distribution
Standard Normal Distribution
Approximating Binomial with Normal
t-test
Hypothesis Testing
Type I and Type II Errors
Statistical Significance and Practical Significance
Hypothesis Testing Process
One-Tailed — Known Standard Deviation
Two-tailed — Known Standard Deviation
One-Tailed — Unknown Standard Deviation
Paired t-test
ANOVA
Chi-Square (χ2)
Regression
Simple Linear and Multiple Linear Regression
Least Squares Error Estimation
Overview
Sample Size
Choice of Variables
Assumptions
Normality
Linearity
Dummy Variables
Interaction Effects
Variable Selection Methods
Issues with Variables
Multicollinearity
Outliers and Influential Observations
Coefficient of Determination (R2)
Adjusted R2
F-ratio: Overall Model
t-test: Coefficients
Goodness-of-fit
Validation
Process
Factor Analysis
- Basic Statistics
- Sampling
- Marketing mix Modelling
Coronavirus — What the metrics do not reveal?
Coronavirus — Determining death rate
- Marketing Education
- Is Marketing Education Fluffy and Weak?
- How to Choose the Right Marketing Simulator
- Self-Learners: Experiential Learning to Adapt to the New Age of Marketing
- Negotiation Skills Training for Retailers, Marketers, Trade Marketers and Category Managers
- Simulators becoming essential Training Platforms
- What they SHOULD TEACH at Business Schools
- Experiential Learning through Marketing Simulators
-
MarketingMind
Basic Statistics
Basic Statistics
Probability Theory
Mutually Exclusive Events and Overlapping Events
Objective and Subjective Probabilities
Conditional (Posterior) Probability
Independent Events
Law of Total Probabilities
Bayes Theorem
Discrete Probability Distribution
Binomial Distribution
Poisson Distribution
Relationship between Variables
Covariance and Correlation
Joint Probability Distribution
Sum of Random Variables
Correlation and Causation
Simpson’s Paradox
Continuous Probability Distributions
Uniform Distribution
Exponential Distribution
Normal Distribution
Standard Normal Distribution
Approximating Binomial with Normal
t-test
Hypothesis Testing
Type I and Type II Errors
Statistical Significance and Practical Significance
Hypothesis Testing Process
One-Tailed — Known Standard Deviation
Two-tailed — Known Standard Deviation
One-Tailed — Unknown Standard Deviation
Paired t-test
ANOVA
Chi-Square (χ2)
Regression
Simple Linear and Multiple Linear Regression
Least Squares Error Estimation
Overview
Sample Size
Choice of Variables
Assumptions
Normality
Linearity
Dummy Variables
Interaction Effects
Variable Selection Methods
Issues with Variables
Multicollinearity
Outliers and Influential Observations
Coefficient of Determination (R2)
Adjusted R2
F-ratio: Overall Model
t-test: Coefficients
Goodness-of-fit
Validation
Process
Factor Analysis
- Basic Statistics
- Sampling
- Marketing mix Modelling
Coronavirus — What the metrics do not reveal?
Coronavirus — Determining death rate
- Marketing Education
- Is Marketing Education Fluffy and Weak?
- How to Choose the Right Marketing Simulator
- Self-Learners: Experiential Learning to Adapt to the New Age of Marketing
- Negotiation Skills Training for Retailers, Marketers, Trade Marketers and Category Managers
- Simulators becoming essential Training Platforms
- What they SHOULD TEACH at Business Schools
- Experiential Learning through Marketing Simulators
Probability Theory
Quantitative research relies on probability theory to analyse and interpret data, make predictions, and draw meaningful conclusions. This introduction aims to provide an overview, covering essential terms and concepts within the realm of probability theory in the context of marketing analytics and quantitative research.
Objective and Subjective
In general, probabilities can be classified into two types: objective probabilities and subjective probabilities:
- Objective probabilities that can be estimated from proportions, based on empirical data. For instance, P(Q), or for instance, the probability that a retail store is handling the brand Coca-Cola.
- Subjective probabilities that cannot be estimated from long-run proportions. For example, an applicant feels she has a 50% chance of getting a job. This is her opinion, and it is subjective.
Terms and Concepts
A random variable is a variable whose possible values are numerical outcomes of a probabilistic experiment. It can either be discrete, taking a finite set of numeric values, or continuous, in which case the range of values is infinite.
Probability is the likelihood that an event will occur. It varies between 0 and 1, where 0 indicates impossibility and 1 indicates certainty. The higher the probability, the more likely that the event will occur.
Probability is defined in the context of a sample space or universe, i.e., a set of all possible outcomes. For instance, the universe of stores in retail tracking, is all the stores that represent the “total market” measured by the tracking service.
As an example, consider pack of cards. The universe constitutes the 52 cards shown in Exhibit 34.1. If you pick a card at random, the probability it will be a queen, P(Q), is 4/52, and the probability it will be the queen of hearts, P(Qhearts) is 1/52.

The complement of an event, Q, is the probability that the event will not occur. It is denoted by: Q̄: P(Q̄)=1−P(Q).
The probability that the card you pick is not a queen, is 1 – P(Q) = 48/52.
Mutually Exclusive Events and Overlapping Events
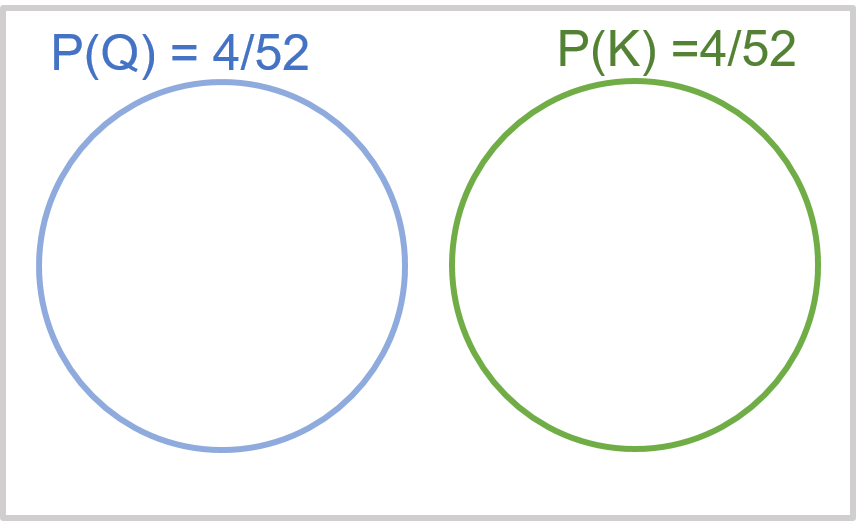
As shown in Exhibit 34.3, the events picking a queen (Q) and picking a king (K) are mutually exclusive; their range of possible values do not overlap. For such mutually exclusive events, the probability that either one or the other will occur, is a summation of their individual probabilities:
$$P(Q \,or \,K) = P(Q) + P(K)$$The probability that the card is either a queen or a king is 4/52 + 4/52 = 8/52.
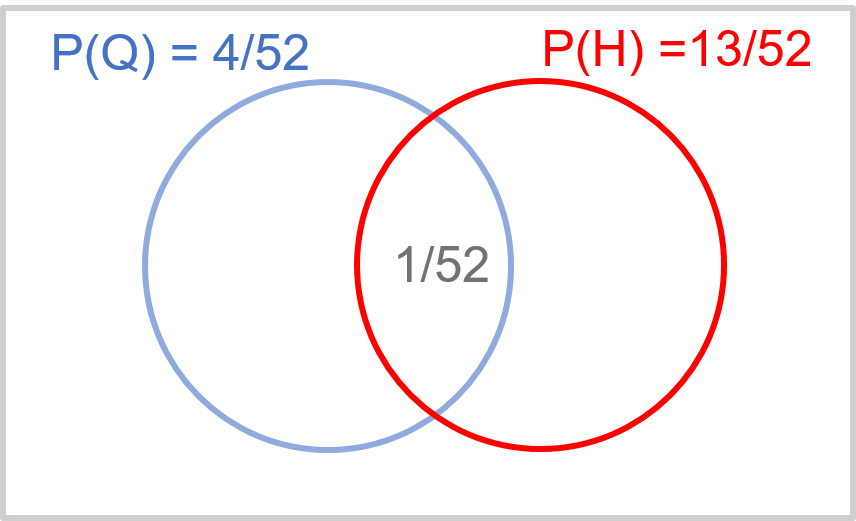
If Q and H are not mutually exclusive events, their range of possible values will overlap as shown in Exhibit 34.4, and the probability that either will occur is:
$$P(Q \,or \,H) = P(Q) + P(H) - P (Q \,and \,H)$$The probability that the card is either a queen or a heart is 4/52 + 13/52 – 1/52.
Conditional (Posterior) Probability
Conditional Probability is the probability of an event given that another event has already occurred. For instance, probability that the card is a queen, given it is a heart.
$$P(Q|H) = \text{probability that Q will occur, given H has occurred.}$$ $$P(Q│H)=(P(Q∩H))/(P(H))=(1/52)/(13/52)$$This implies:
$$P(Q∩H)=P(Q│H)×P(H)=P(H│Q)×P(Q)$$Independent Events
Events are independent if knowing whether one has occurred does not change the probability of the other.
Suppose you pick a card and toss a coin. The probability of getting a tail, P(T), in no way influences the probability of getting a queen, P(Q), from a pack of cards.
$$P(T│Q)=P(T),\,and \,P(Q│T)=P(Q)$$ $$P(T∩Q)=P(T)×P(Q)$$Law of Total Probabilities

The law of total probability is a rule relating marginal probabilities to conditional probabilities. It expresses the total probability of an outcome which can be realized via several distinct events.
Consider n mutually exclusive and collectively exhaustive events, A1, A2 … An, the probability for any event B to occur:
$$P(B)=\sum_{i=1}^n P(B∩A_i )=P(B∩A_1 )+P(B∩A_2 )… P(B∩A_n)$$ $$P(B)=P(B│A_1 )P(A_1 )+P(B│A_2 )P(A_2 )… P(B|A_n)P(A_n)$$Taking cards for example (Exhibit 34.5), the probability of picking a queen:
$$P(Q)=P(Q│H)P(H)+P(Q│D)P(D)+P(Q|C)P(C)+P(Q|S)P(S)$$Basically, this is the same as weighted average.
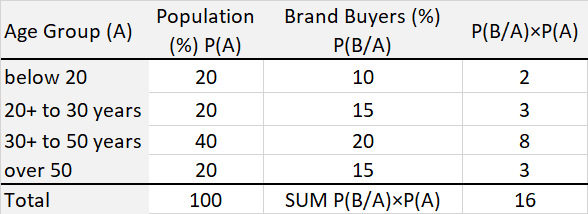
Example: As shown is Exhibit 34.6, the age profile of a target population (universe) is broken down into 4 groups: below 20, 20 to 30, 30 to 50 and over 50. The proportion of the population that falls in each group is 20%, 20%, 40% and 20% respectively, and the proportion of brand buyers in each is 10%, 15%, 20% and 15%. Based on this information, the proportion of brand buyers in the target population is 16%, as computed in Exhibit 34.6.
Previous Next
Use the Search Bar to find content on MarketingMind.


Contact | Privacy Statement | Disclaimer: Opinions and views expressed on www.ashokcharan.com are the author’s personal views, and do not represent the official views of the National University of Singapore (NUS) or the NUS Business School | © Copyright 2013-2026 www.ashokcharan.com. All Rights Reserved.