
-
Basic Statistics
Basic Statistics
Probability Theory
Mutually Exclusive Events and Overlapping Events
Objective and Subjective Probabilities
Conditional (Posterior) Probability
Independent Events
Law of Total Probabilities
Bayes Theorem
Discrete Probability Distribution
Binomial Distribution
Poisson Distribution
Relationship between Variables
Covariance and Correlation
Joint Probability Distribution
Sum of Random Variables
Correlation and Causation
Simpson’s Paradox
Continuous Probability Distributions
Uniform Distribution
Exponential Distribution
Normal Distribution
Standard Normal Distribution
Approximating Binomial with Normal
t-test
Hypothesis Testing
Type I and Type II Errors
Statistical Significance and Practical Significance
Hypothesis Testing Process
One-Tailed — Known Standard Deviation
Two-tailed — Known Standard Deviation
One-Tailed — Unknown Standard Deviation
Paired t-test
ANOVA
Chi-Square (χ2)
Regression
Simple Linear and Multiple Linear Regression
Least Squares Error Estimation
Overview
Sample Size
Choice of Variables
Assumptions
Normality
Linearity
Dummy Variables
Interaction Effects
Variable Selection Methods
Issues with Variables
Multicollinearity
Outliers and Influential Observations
Coefficient of Determination (R2)
Adjusted R2
F-ratio: Overall Model
t-test: Coefficients
Goodness-of-fit
Validation
Process
Factor Analysis
- Basic Statistics
- Sampling
- Marketing mix Modelling
Coronavirus — What the metrics do not reveal?
Coronavirus — Determining death rate
- Marketing Education
- Is Marketing Education Fluffy and Weak?
- How to Choose the Right Marketing Simulator
- Self-Learners: Experiential Learning to Adapt to the New Age of Marketing
- Negotiation Skills Training for Retailers, Marketers, Trade Marketers and Category Managers
- Simulators becoming essential Training Platforms
- What they SHOULD TEACH at Business Schools
- Experiential Learning through Marketing Simulators
-
MarketingMind
Basic Statistics
Basic Statistics
Probability Theory
Mutually Exclusive Events and Overlapping Events
Objective and Subjective Probabilities
Conditional (Posterior) Probability
Independent Events
Law of Total Probabilities
Bayes Theorem
Discrete Probability Distribution
Binomial Distribution
Poisson Distribution
Relationship between Variables
Covariance and Correlation
Joint Probability Distribution
Sum of Random Variables
Correlation and Causation
Simpson’s Paradox
Continuous Probability Distributions
Uniform Distribution
Exponential Distribution
Normal Distribution
Standard Normal Distribution
Approximating Binomial with Normal
t-test
Hypothesis Testing
Type I and Type II Errors
Statistical Significance and Practical Significance
Hypothesis Testing Process
One-Tailed — Known Standard Deviation
Two-tailed — Known Standard Deviation
One-Tailed — Unknown Standard Deviation
Paired t-test
ANOVA
Chi-Square (χ2)
Regression
Simple Linear and Multiple Linear Regression
Least Squares Error Estimation
Overview
Sample Size
Choice of Variables
Assumptions
Normality
Linearity
Dummy Variables
Interaction Effects
Variable Selection Methods
Issues with Variables
Multicollinearity
Outliers and Influential Observations
Coefficient of Determination (R2)
Adjusted R2
F-ratio: Overall Model
t-test: Coefficients
Goodness-of-fit
Validation
Process
Factor Analysis
- Basic Statistics
- Sampling
- Marketing mix Modelling
Coronavirus — What the metrics do not reveal?
Coronavirus — Determining death rate
- Marketing Education
- Is Marketing Education Fluffy and Weak?
- How to Choose the Right Marketing Simulator
- Self-Learners: Experiential Learning to Adapt to the New Age of Marketing
- Negotiation Skills Training for Retailers, Marketers, Trade Marketers and Category Managers
- Simulators becoming essential Training Platforms
- What they SHOULD TEACH at Business Schools
- Experiential Learning through Marketing Simulators
t-test
The t-test is a test to statistically determine whether the means of two normally distributed groups are different. It is commonly used with small sample sizes when the variances of the two normal distributions is not known. The test also assumes that the distributions are independent.
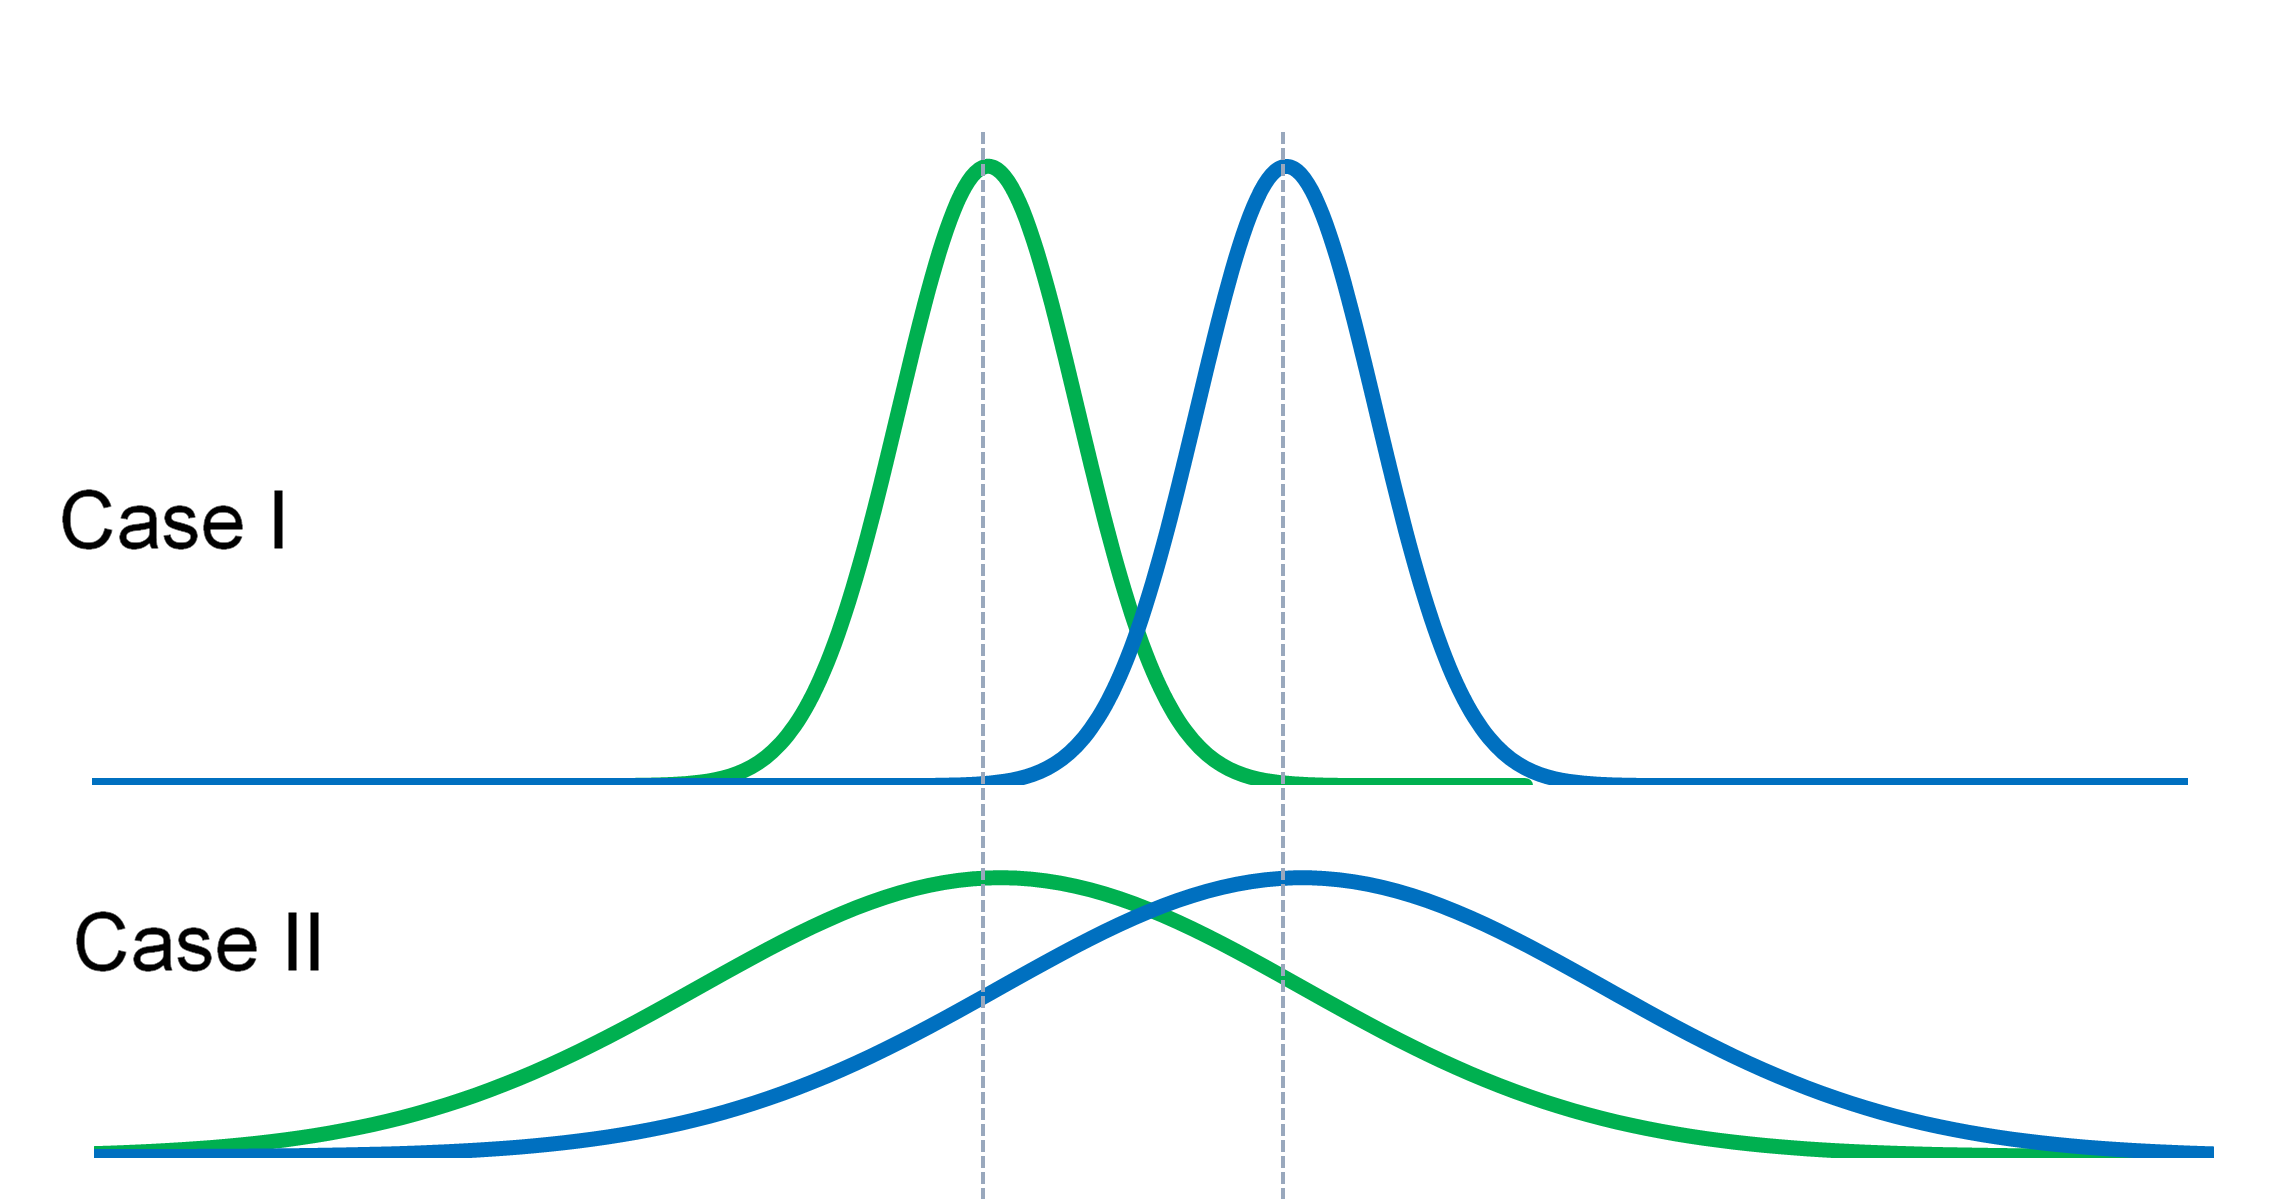
To understand how the t-test works, consider Exhibit 34.19. In both case scenarios, the difference in the means is the same. However, the probability that green is different from blue is much higher for Case I, where the sample variability is much lower, and, consequently, there is much less overlap between their distributions.
So, in order to identify the difference between the means of two groups, the t-test must measure the difference in means relative to the variability within each group.
The test summarizes the data down to a single value, the t-value, a signal-to-noise ratio accounting for the difference in means relative to the variability in the data:
$$ t = \frac {signal}{noise} = \frac {difference \; in \; group \; means}{variability \; of \; groups} = \frac {x̄_1-x̄_2}{σ_{x̄_1-x̄_2}} $$ $$ σ_{x̄_1-x̄_2} = \sqrt {\frac {s_1^2}{n_1} + \frac {s_2^2}{n_2}} $$Since s1 and s2, the standard deviation for the two groups, is not known these values are derived from the group samples.
The significance of the t-value is related to the samples’ degrees of freedom, which is equal to n1 + n2 – 2, if the standard deviation for the two groups is the same (s1 = s2). Otherwise, the formula is:
$$ degrees\;of\; freedom\; (df) = \frac {\left(\frac {s_1^2}{n_1} + \frac {s_2^2}{n_2}\right)^2} {\frac{(s_1^2/n_1)^2}{n_1-1}+\frac {(s_2^2/n_2)^2}{n_2-1}} $$Given the t-value and the degrees of freedom (df), we can estimate the probability (p-value) that the means of two groups are the same, i.e., the hypothesis (x̄1=x̄2).
The p-value is obtained from the t-distribution table by looking for the t-value in the row for degrees of freedom = df.
Note: A p-value from t-value calculator is provided on this webpage. In Excel, the data analysis add-in provides an easy-to-use facility to conduct the t-test.
If the p-value is lower than α, the significance level (usually set at 5% for market research studies), then the hypothesis that the two groups have the same mean is rejected.
Previous Next
Use the Search Bar to find content on MarketingMind.


Contact | Privacy Statement | Disclaimer: Opinions and views expressed on www.ashokcharan.com are the author’s personal views, and do not represent the official views of the National University of Singapore (NUS) or the NUS Business School | © Copyright 2013-2026 www.ashokcharan.com. All Rights Reserved.