The Central Limit Theorem (CLT) forms the theoretical
foundation for determining sample size. The theorem states that, as the sample size increases,
the sampling distribution of the mean x̄ (or the percentage valuep̄) of a variable
X, obtained from a simple random sample, will approach a normal distribution. This holds
true regardless of the underlying distribution of the population.
For example:
- Universe size = N
- Sample size = n
- Mean value = μ
- Sample mean values:
- Sample 1: x̄1
- Sample 2: x̄2
- Sample 3: x̄3
- Sample 4: x̄4 etc.
According to the CLT, the frequency distribution of the
average values x̄1, x̄2, x̄3, x̄4 ... of
a variable X, obtained from samples taken from the universe,
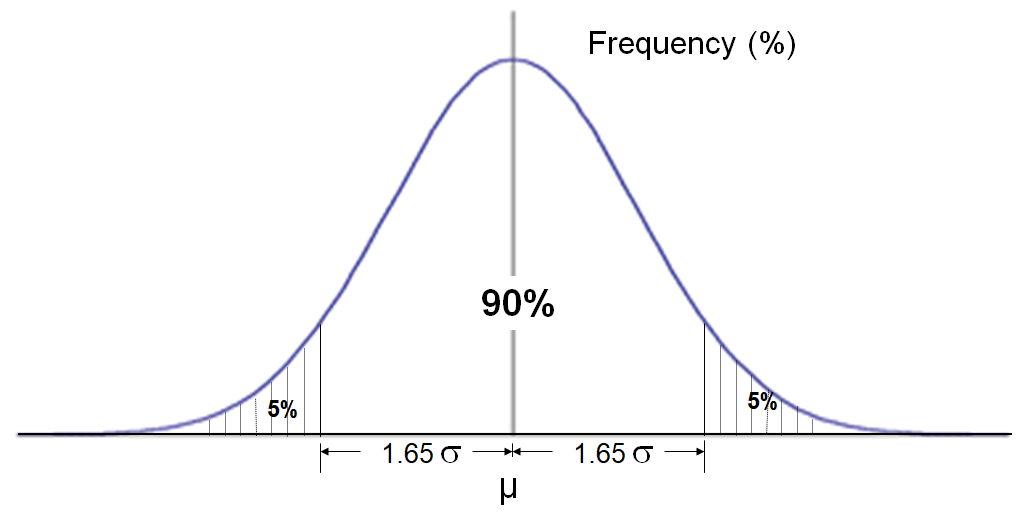
follows the bell-shaped normal distribution curve shown in Exhibit 35.2.

Exhibit 35.2 90% of the observations fall within a range of ±1.65 standard
deviation from the mean.
While each sample yields a different mean for the
variable being measured, based on the theorem, it can be expected that all
samples of the same size and design will yield a result that lies within a
measured range around the true value.
The CLT further states that if repeated random
samples of size n are drawn from a large population along some
variable X, having a mean μ and variance S2,
then the sampling distribution of sample mean will approximate a normal distribution
with a mean μ and a variance s 2
= S2/n. The standard deviation s
of the sampling distribution is referred to as the standard error of the mean.
For any parameter, although we cannot determine the exact proximity of the
true value to the measured value, we can rely on the properties of the normal distribution
to infer with 95% confidence that it falls within ± two times the standard error (1.96, to
be precise).