
-
Articles
- Marketing Education
Is Marketing Education Fluffy and Weak?
How to Choose the Right Marketing Simulator
Self-Learners: Experiential Learning to Adapt to the New Age of Marketing
- Negotiation Skills Training for Retailers, Marketers, Trade Marketers and Category Managers
Simulators becoming essential Training Platforms
What they SHOULD TEACH at Business Schools
Experiential Learning through Marketing Simulators
-
MarketingMind
Articles
- Marketing Education
Is Marketing Education Fluffy and Weak?
How to Choose the Right Marketing Simulator
Self-Learners: Experiential Learning to Adapt to the New Age of Marketing
- Negotiation Skills Training for Retailers, Marketers, Trade Marketers and Category Managers
Simulators becoming essential Training Platforms
What they SHOULD TEACH at Business Schools
Experiential Learning through Marketing Simulators
Coverage Analysis — Retail Tracking
Marketing research is often clouded with ambiguity and distrust. Finger pointing often starts when a brand starts to lose market share. We sold 100,000 units, but you are reporting only 50,000. How can a sample of 50 stores accurately project for a universe of 5,000?
One might as well ask: how can a drop of blood confirm that a patient is suffering from an incurable decease? The correct observation, however, would be that the drop of blood indicates there is 95% likelihood that the patient is suffering from cancer. In sampling, there is always some margin of error.
In practice, to protect themselves from the scrutiny of their clients, marketing research firms usually over-engineer their services ensuring that sample sizes are significantly above the design specifications. Even so accusations do fly. Moreover, it is not always easy to explain the concept of coverage or the statistics that form the foundation of data science.
So, in this section on coverage analysis, I am going into some detail to explain in layman terms, the measurement science behind the numbers and the factors that affect coverage. If you are a user of marketing research, especially retail measurement services, I hope this will ease any concerns you might have regarding the data’s reliability.
While this section covers aspects about the design, and the strengths and limitations of retail tracking services, and it is followed by several case examples, it does not go into the statistics of sampling or the sampling equations. For a technical elaboration on how samples are designed, you should refer to Chapter 34, Sampling.
Contents
Why Coverage is IncompleteCoverage Gap
Pipeline Effect
Coverage over a Product’s Life Cycle
How Distribution Affects Coverage
Coverage Analysis
Coverage Analysis — Case Examples
- Kraft Builder, Indonesia — Pipeline Effect
- Organics Shampoo and Campbell Soup — Investment Buying
- Abbott Laboratories, Malaysia — Misleading Data
Why Coverage is Incomplete
Marketers often struggle to bridge the void between the theoretical concepts and the practical real-world limitations. Unlike financial statements where dollars and cents must add up, marketing research and analytics reports intended to impart an understanding of market dynamics, do not require complete, 100% coverage.
In the realm of market research, compromises must be made between the costs associated with expanding services and the benefits derived from doing so. The development of a research or analytics service remains a business decision that must take into account clients’ budget constraints.
Like other forms of market intelligence, retail tracking data which meets acceptable accuracy standards, remains useful, provided one is aware of what is covered and what is not covered, and provided one appreciates the strengths and limitations of the data. While utility generally increases with broader coverage, it is important to have a clear understanding of the data’s scope.
In summary, marketers should recognize that marketing research and analytics reports, including retail tracking data, can be useful even with varying levels of coverage. The key lies in understanding the extent of coverage, appreciating the data’s strengths and limitations, and utilizing it in a manner that aligns with the specific business objectives.
Coverage Gap
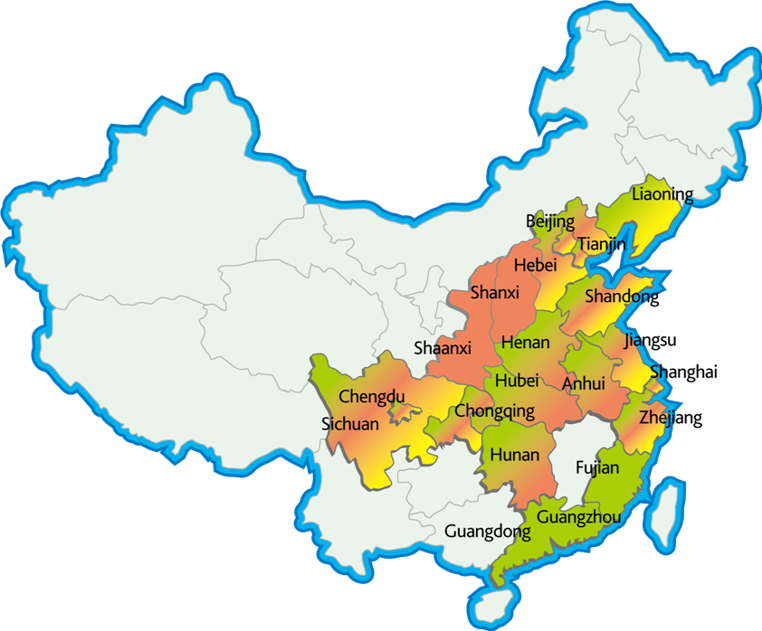
The retail measurement service (RMS) tracks the sales of goods from retailers to consumers, at specific outlets in a predefined geographical area referred to as the retail universe. This universe is usually not the same as the supplier’s sales territory. For example in China (Exhibit 6), NielsenIQ tracks the densely populated urban provinces of China, leaving out the sparsely populated regions in the West.
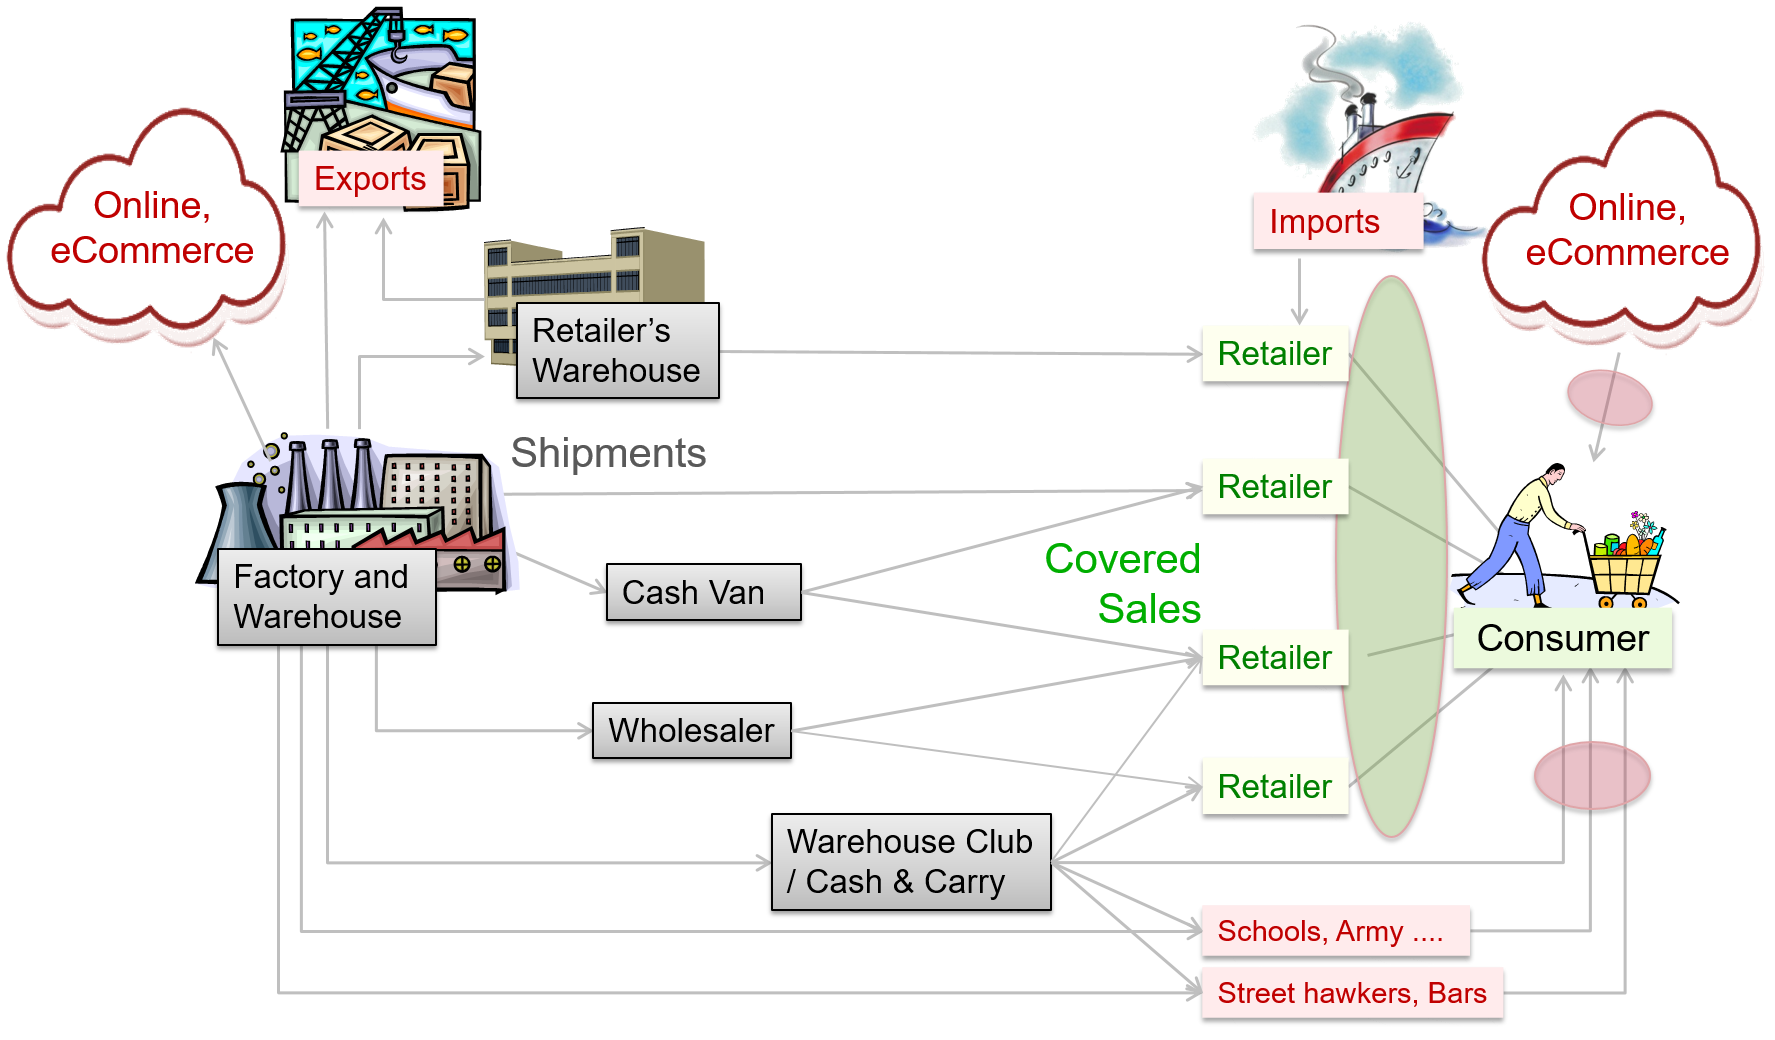
Moreover, as depicted in Exhibit 16, within the same geographical territory covered by a retail tracking service, the supplier may sell to outlets at locations such as schools and military establishments that are not accessible to retail auditors.
There are several such inaccessible or non-participating outlets, and many of them are important contributors to sale of some product categories. For instance, stalls at enclosed construction sites sell a lot of cigarettes. Or for instance, non-participating outlets at tourist locations sell large quantities of impulse products like ice cream and chocolates.
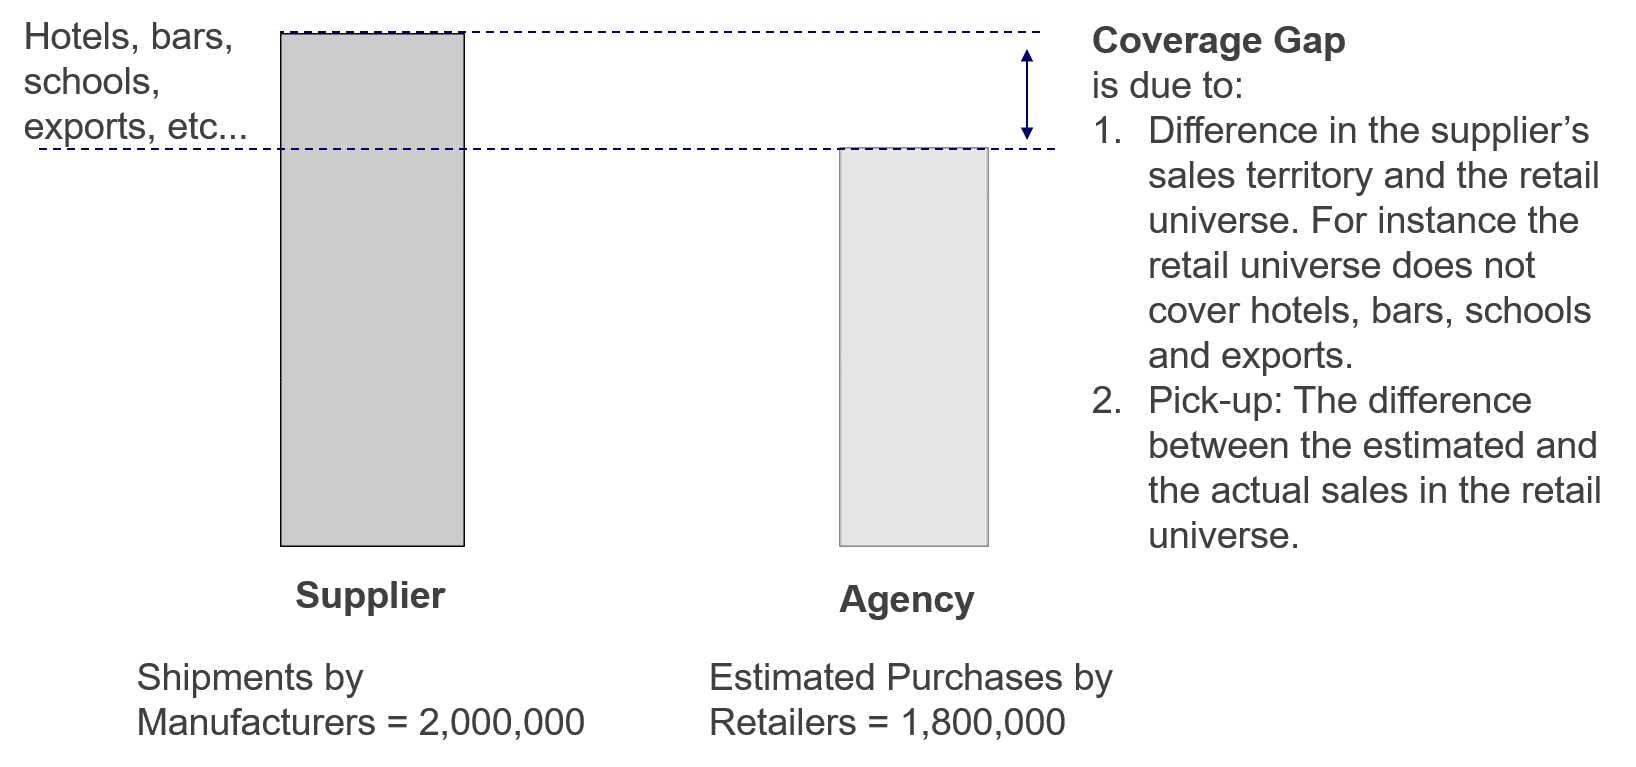
Exhibit 17 Coverage gap is the shortfall between the agency’s estimated purchases by retailers and the manufacturer’s shipments.
The coverage gap, as depicted in Exhibit 17, represents the difference between the supplier’s shipments and the agency’s estimate of store purchases. This gap can arise due to several reasons:
Retail Universe vs. Sales Territory: The retail universe, which includes retail outlets covered by the retail tracking service, does not align with the supplier’s designated sales territory.
Exports and Imports, or Parallels: If a significant portion of goods sold in the retail universe consists of imported or parallel products, the coverage may even exceed 100%. This occurs for instance, when a large proportion of bar soap sold in Singapore is sourced from Indonesia.
Pick-up error: Estimating store purchases involves sampling methods, tracking methodologies, or data collection processes that can introduce inaccuracies. These inaccuracies, known as pick-up errors, can contribute to the coverage gap.
Pipeline Effect
Pipeline Effect: The pipeline effect arises from the fluctuations in inventory levels within the distribution pipeline comprising of all the intermediate locations that products pass through as they move from suppliers’ warehouses to consumers’ shopping carts. The pipeline’s existence creates a time lag between the moment a product is shipped from the supplier’s warehouse to the instance it is bought by a consumer.
Due to this time lag, when stocks build up or deplete within the distribution pipeline, the supplier’s shipments will differ from store purchases, and that difference will be due to the increase or decrease in inventory levels.
Fluctuations in inventory can be influenced by various factors, including:
- Irregular shipment patterns. Changes in intermediaries, such as the appointment of new distributors, can disrupt the regular flow of shipments and lead to inventory fluctuations.
- Investment Buying. When suppliers offer high trade discounts or special incentives, distributors or retailers may engage in investment buying, resulting in sudden increases in pipeline inventory.
- Trade and Consumer Promotions. Trade promotions, including discounts and other incentives, as well as consumer promotions, can impact stock levels within the pipeline. These promotions may cause temporary spikes or dips in inventory and sales.
- Product Longevity. Products with longer shelf lives tend to remain in the pipeline for extended periods. Conversely, perishable items like bread or pasteurized milk have shorter pipelines as they are delivered more frequently from the factory directly to retail stores.
- Distribution Network. The complexity of the distribution network, which may involve wholesalers, agents, distributors, and concessionaires, can influence the length of the pipeline.
- Geography or Sales Territory Size. Larger countries and vast sales territories require more extensive distribution networks. Their size and geography impacts inventory logistics and coverage.
- Product life cycle. Coverage varies over the life cycle of products, as detailed in the next section.
Coverage over a Product’s Life Cycle
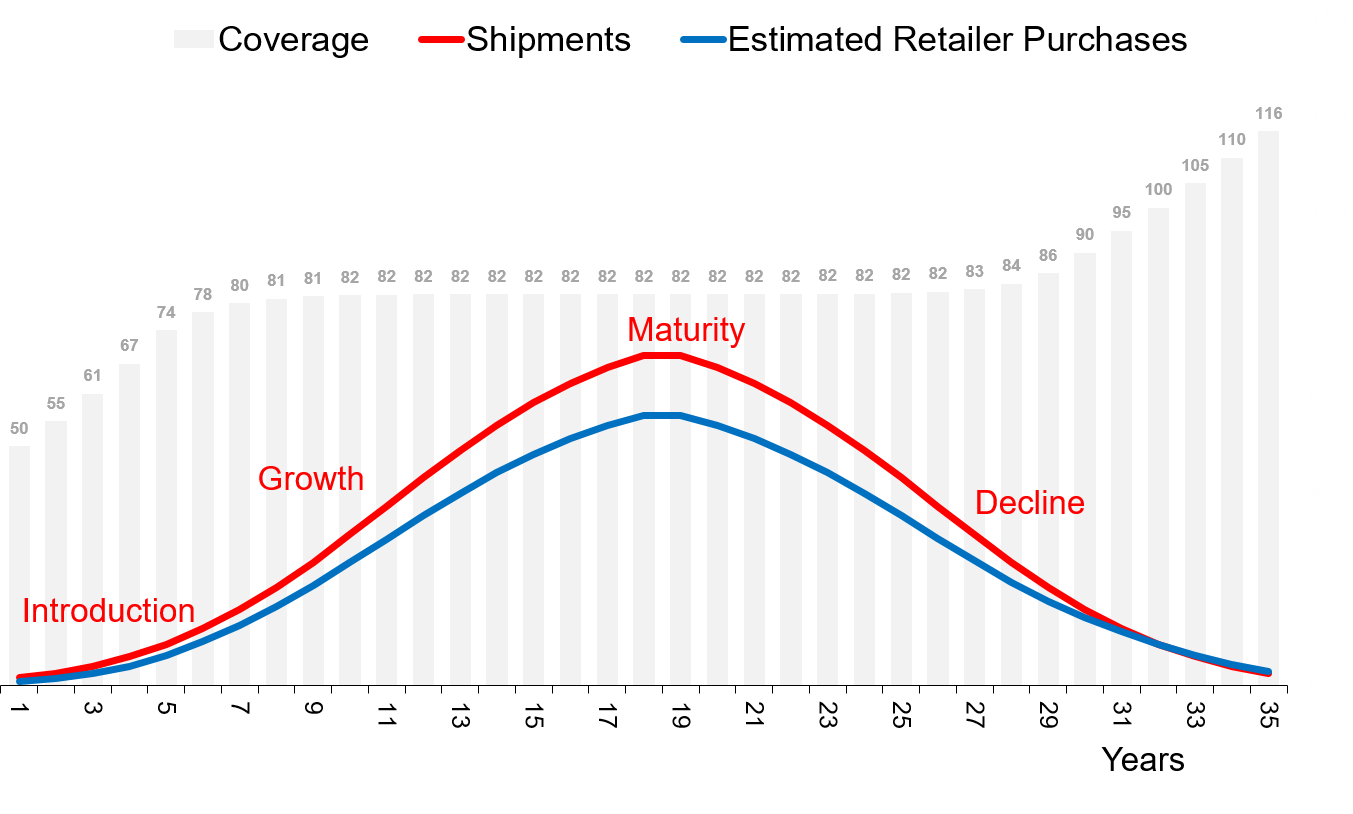
Exhibit 18 Coverage varies over a product’s life cycle, particularly during its introduction and decline. (As there are many other factors affecting coverage, it will fluctuate more widely than shown in this illustration).
When a product is introduced, the distribution pipeline begins to fill up and expand. During this phase, a significant portion of shipments is dedicated to building up inventory within the pipeline. As a result, the coverage, which is the ratio of retailer purchases to shipments, is typically well below norm.
As the pipeline fills up and the expansion of the distribution network begins to level off, coverage starts to stabilize. (Refer illustration in Exhibit 18).
When a product enters the decline stage of its life cycle, the distribution pipeline begins to shrink, and pipeline inventories decline. As intermediaries, such as distributors and retailers, reduce their stocks, they tend to buy less than what they sell. So, the flow of products at the beginning of the pipeline decreases at a faster pace compared to the flow towards the end of the pipeline. This imbalance between manufacturer shipments and retailer purchases leads to significantly lower shipments from the manufacturer, and increased coverage level, reflecting a higher ratio of retailer purchases to shipments.
How Distribution Affects Coverage
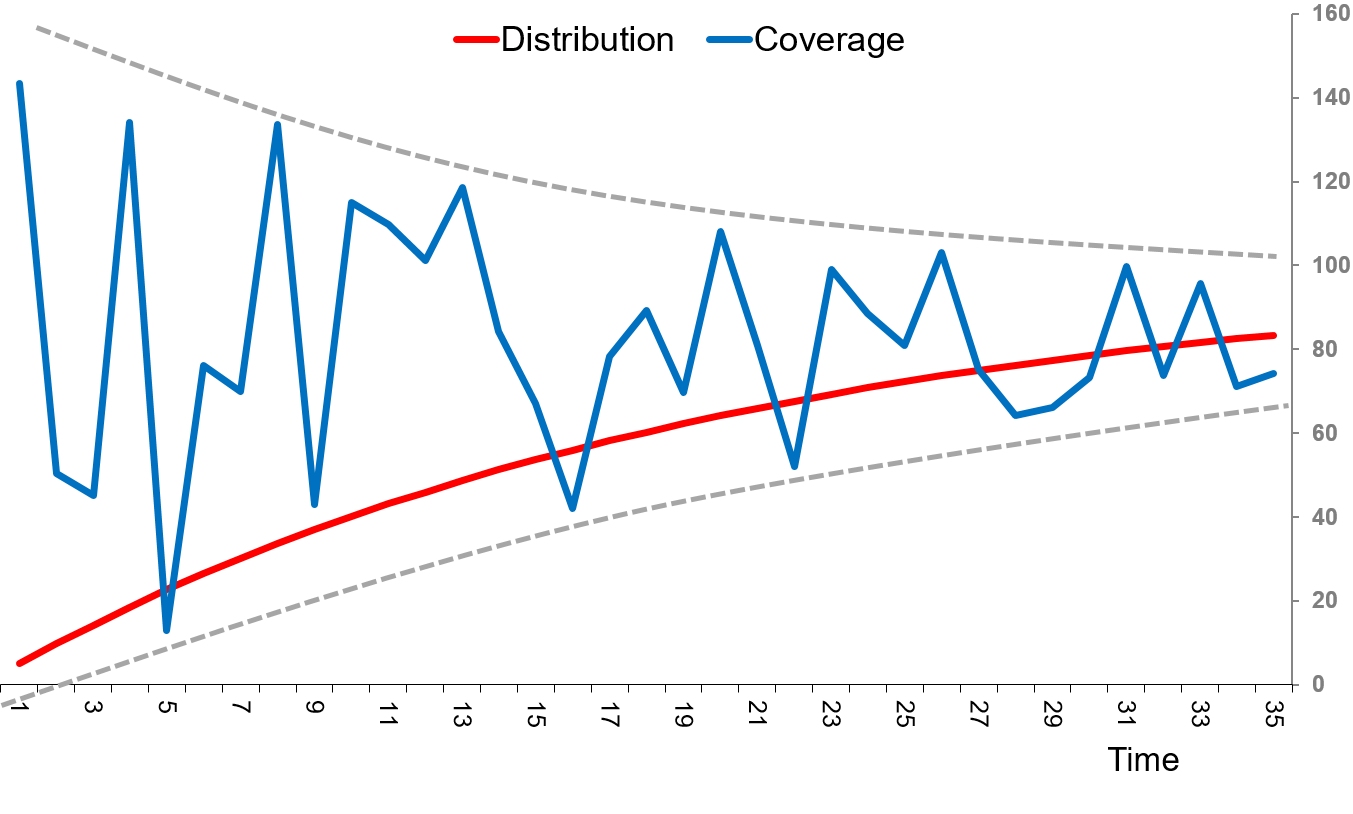
The accuracy of the purchases and sales estimates is affected by the level of distribution of a product. When the distribution is low, the number of stores stocking the product in the agency’s sample of retail outlets is small.
For example, if the sample size is 1,000, and product distribution is 80%, then there are likely to be about 800 stores in the sample that carry the product and the effective sample size is 800. On the other hand, if product distribution is only 1%, the effective sample size is just 10 stores.
As distribution expands, the product is likely to be found in more stores within the agency’s sample of retail outlets. The resulting increase in the effective sample size improves the accuracy of the purchases and sales estimates. As can be seen from Exhibit 19, this reduces the volatility in coverage estimates, which is markedly high when the product’s distribution is low.
Coverage Analysis
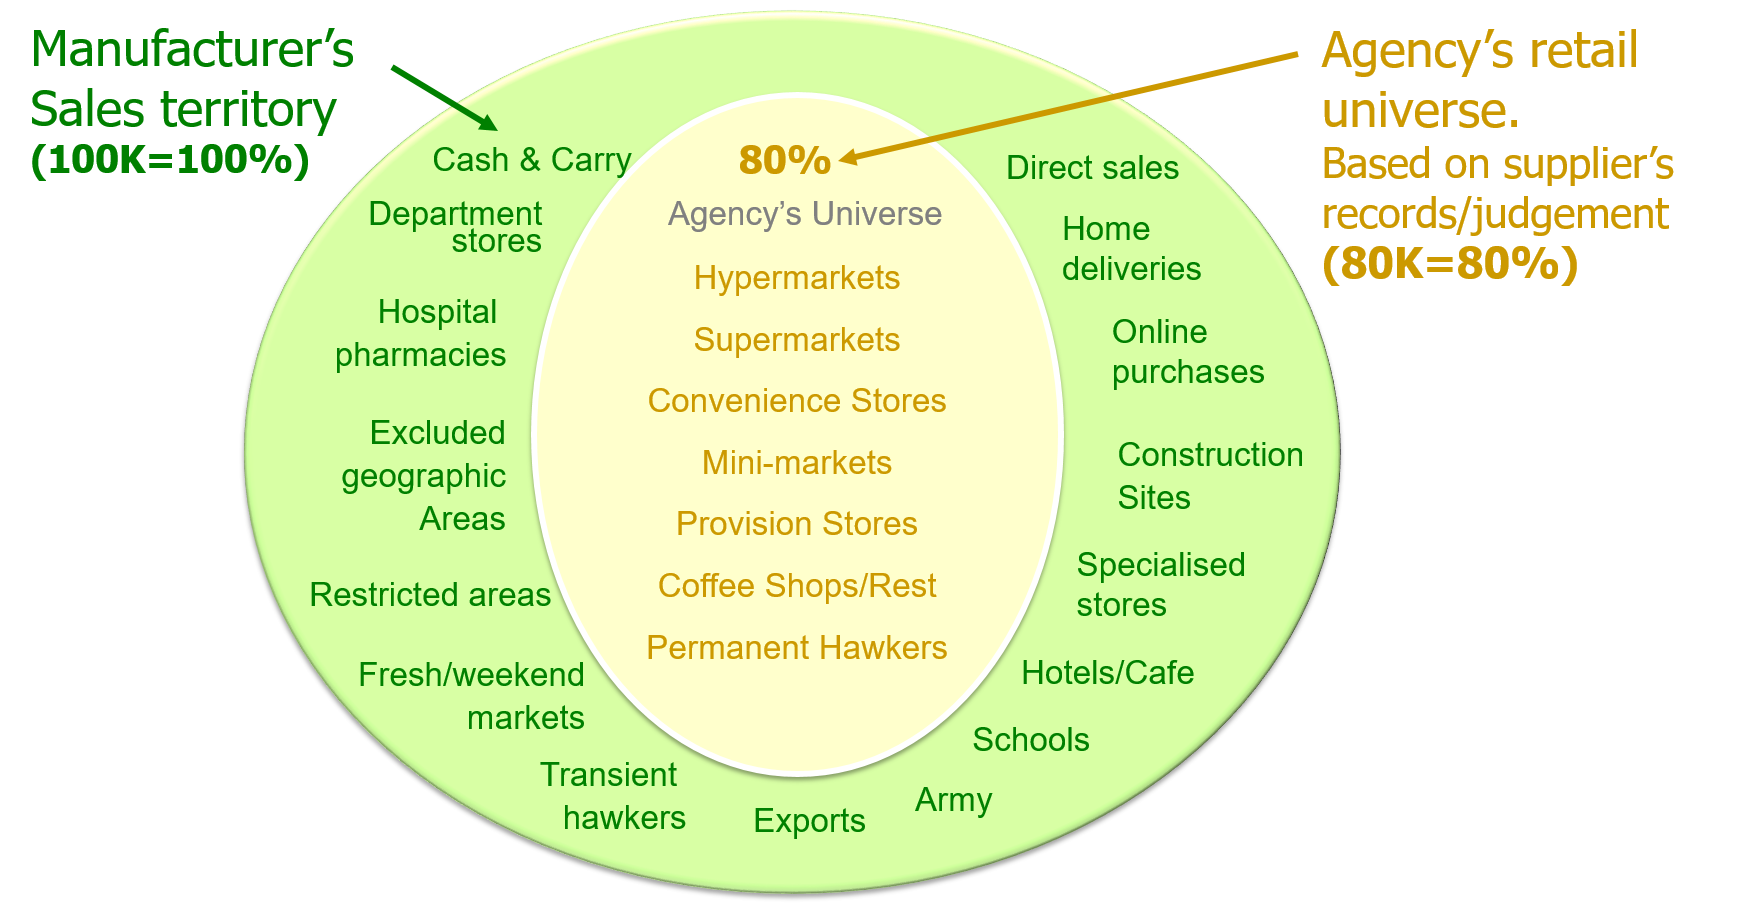
Exhibit 20 Expected coverage is the proportion of supplier’s total shipments that go to the retail universe. In this example, based on sales records and judgement, the manufacturer estimates that 80% of total shipments go through the outlets covered by the agency.
Coverage analysis is an important exercise that helps the research agency and its clients assess coverage, and understand the reasons contributing to the gap. This understanding is used by the agency to prioritize improvements to their service. And as illustrated by the case examples that follow, it can reveal very useful insights into the dynamics of clients’ distribution networks and guide them with their interpretation of the data.
Coverage analysis is based on moving annual totals (MAT) of reported retailer purchases and manufacturer’s shipments. It relies on three parameters:
- Coverage: The agency’s estimated retailer purchase volume as a percentage of supplier’s shipments.
- Expected Coverage: The proportion of supplier’s total shipments that go to the retail universe, based on supplier’s records and their assessment. This takes into consideration known coverage gaps such as geographical regions, market breakdowns and chains/outlets that are not covered by the retail tracking service.
- Pick Up: The agency’s estimated retailer purchase volume as a percentage of supplier’s shipments that go to the retail universe.
It follows from the above definitions that: $$Coverage \,= \,Expected \,Coverage \,× \,Pick \,Up$$
Coverage reflects how the research estimates relate to the supplier’s total shipment and is dependent on the extent that the retail universe captures the manufacturer’s shipments (expected coverage) as well as the accuracy of the research methodology (pick up).
Pick up is a measure of the accuracy of the research methodology and is dependent on the sampling framework as well as non-sampling errors. With reference to the example in Exhibit 20, the coverage, expected coverage and pick-up are computed as follows:
- Total Shipment = 100 thousand units.
Supplier’s shipment of product in the sales territory is 100 thousand units. - Shipment into Retail Universe = 80 thousand units.
Based on sales records and assessment, the manufacturer estimates that a total of 80,000 units were sold to the retailers covered by the agency. - Expected Coverage = 80K/100K = 80%.
The estimated proportion of supplier’s total shipments that go to the retail universe. - Retailer Purchases = 72 thousand unit.
The agency’s estimated retailer purchase volume of the product. - Pick Up = 72K/80K = 90%.
The agency’s estimated retailer purchase volume as a percentage of supplier’s shipments that go to the retail universe. - Coverage=72K/100K=72%=Expected Coverage×Pick Up
The agency’s estimated retailer purchase volume as a percentage of supplier’s shipments.
Since coverage analysis is conducted on moving annual total (MAT) sales, it moderates pipeline effects and smoothens out the impact of promotions and seasonality. It also evens out the variances in the manufacturer’s shipments which can be volatile with peaks and troughs over months.
The sales territory in a coverage analysis should represent the total country. This reduces errors due to intra-country movement of goods.
Note also that coverage analysis is appropriate for brands with numeric distribution of at least 80%. This conforms with Nielsen’s global standard for sampling error, which applies to products that are available in 80% of the universe. Estimates for products with lower levels of distribution may not meet the agency’s global norms.
Manufacturers should review coverage for major brands once in every two to three years, or more frequently if there are concerns regarding the quality of the data. At the agency, the measurement scientists (or data scientists as they are now called) should be conducting the analysis on a regular basis as it provides critical information on how their service can be enhanced.
Coverage Analysis — Case Examples
Differences between a supplier’s shipments and the agency’s estimate of store purchases can be difficult to comprehend due to the complexities of the distribution networks, pipeline effects, practices such as investment buying, impact of promotions and the peculiarities of a retail tracking service.
A coverage analysis can impart an understanding of the factors contributing to the discrepancies. And, as can be seen from the following case examples, the analysis can also reveal very useful insights into the dynamics of the supplier’s distribution network.
Kraft Builder, Indonesia — Pipeline Effect
In the last quarter of 2007, after Kraft Indonesia acquired Danone’s biscuits business, the company underwent a transformation in its distribution network. The previous network relied on a single national distributor, consisting of 26 branches and 28 sub-districts. The new distribution network, called Builder, relied on 15 territory-level distributors, encompassing 39 branches and 13 sub-districts.
Kraft estimated that the number of outlets stocking their biscuits increased from 87,000 (prior to the Builder network) to 165,000 stores by the end of 2007. As a result, the company experienced a surge of approximately 40% in biscuit shipments in 2008. This accomplishment led CEO Irene Rosenfeld to personally meet and congratulate the Indonesian team during her visit to the Asia Pacific region.
The only dampener was that estimates by Nielsen Indonesia showed substantially lower sales. This discrepancy led to a coverage analysis and an in-depth investigation into the Indonesian retail tracking service.
One year later, in 2009, Kraft’s biscuit shipments plummeted, offsetting the previous surge in 2008. This confirmed the findings from the earlier investigation.
The key reason for the surge in sales in 2008 was the creation of the parallel sales pipeline. The new Builder distribution network was larger, and the depletion of stocks in the old pipeline occurred at a much slower pace than the build-up in the new one. As a result, a large proportion of the 40% increase in sales was due to the expansion of pipeline inventory, which can be substantial in a large country like Indonesia.
When the expansion of the Builder distribution network levelled off, this coupled with depletion in stocks in previous network, resulted in the sharp drop in shipments in 2009. Shipments eventually stabilized once stocks in the phased-out network depleted, and it ceased to exist.
During the transition, while shipments fluctuated wildly, the Nielsen sales estimates grew at a steady pace. The turbulence in the intermediary networks did not adversely affect consumer offtake.
This case goes to show the importance of relying on a well-designed service to track consumer offtake. It also illustrates the use of coverage analysis to increase confidence in retail tracking data and enhance understanding of trade dynamics.
Organics Shampoo and Campbell Soup — Investment Buying
Several years back, when the lower trade was big in Singapore, Organics shampoo year-end shipments to distributors surged from an average of 17 thousand litres per month to 53 thousand litres. This was primarily the outcome of a trade promotion, and though retailer purchases reflected a relatively small increase, consumer purchases remained flat.
Enticed by the promotion, distributors merrily stocked up, inflating the pipeline. And because they did not pass the discounts to the retailers, there was no incentive for them or their customers to purchase more than their usual requirement.
In another example of investment buying, the Campbell Soup Company sold large quantities of canned soup to a dominant supermarket chain by offering a big trade discount. Subsequently the manufacturer’s country head was disappointed that there was no discernible increase in scanned sales even several months after the promotion.
These examples illustrate how investment buying, where distributors or retailers increase their inventory due to promotional offers, may not necessarily result in a corresponding increase in consumer purchases or scanned sales. It highlights the importance of assessing the effectiveness and impact of trade promotions to ensure desired outcomes in terms of sales and consumer behaviour.
Abbott Laboratories, Malaysia — Misleading Data
Abbott Laboratories, the manufacturers of infant formula, substantially increased their sales in Malaysia by expanding into newer channels of distribution. Unfortunately, for the Abbott team, these channels were not covered by Nielsen Malaysia, and so, it turned out that the Nielsen data reflected a misleading decline in sales.
The decline occurred because, while the new unaudited channels led to an overall growth in sales of Abbott’s infant formula, they also cannibalized the established channels covered by Nielsen Malaysia.
Nielsen’s market share was an important KPI for Abbott, and, despite explanations, the reported “decline” did not go down well with the company’s regional and global bosses.
As can be seen from this example, an understanding of the strengths and weaknesses of a retail tracking service, particularly in the context of coverage, is of vital importance in the interpretation of the data.
Previous Next
Use the Search Bar to find content on MarketingMind.


Contact | Privacy Statement | Disclaimer: Opinions and views expressed on www.ashokcharan.com are the author’s personal views, and do not represent the official views of the National University of Singapore (NUS) or the NUS Business School | © Copyright 2013-2026 www.ashokcharan.com. All Rights Reserved.