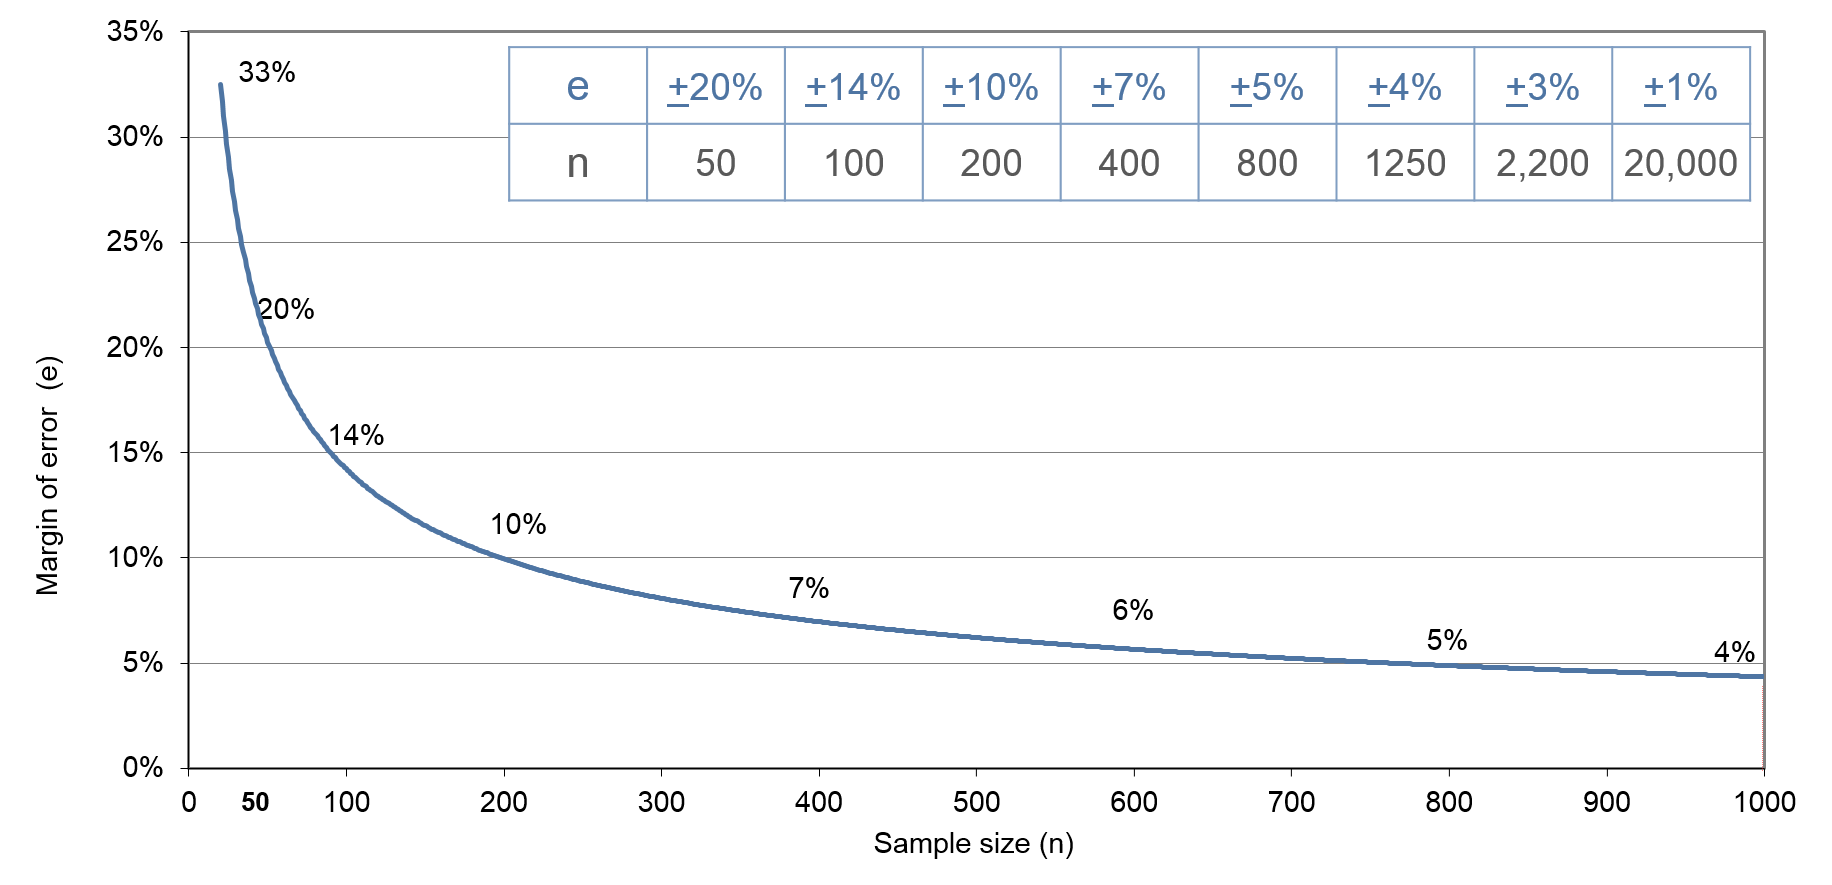
Exhibit 35.6 Required sample size at confidence level of 95%,
across different margins of error, for differences in proportions.
In tracking studies where independent samples are
collected at regular intervals, the focus is often on examining the change in a metric between
these intervals. The standard error of the difference between two proportions, based on samples
with sizes n1 and n2, with success probabilities
p1 and p2 respectively, can be calculated using the formula:
$$ σ=\sqrt{p_1(1-p_1)/n_1+p_2(1-p_2)/n_2}$$
The upper bound for this standard error is
0.5√(1/n1+1/n2).
If the sample sizes are equal (n1 = n2), this formula simplifies to
σ = 1/√(2n).
(Or √{2p(1-p)/n}, not assuming upper bound).
By substituting σ into the equation Z σ = e, for confidence level of 95% (Z ≈ 2), we
can derive the formula for estimating the required sample size (n):
$$ n = \frac {2}{e^2},\; e = \sqrt {\frac {2}{n}}$$
In other words, the estimates of change have margins of error that are
approximately 41% larger (multiplied by √2) compared to the corresponding estimates from
individual surveys. Alternatively, to achieve the same margin of error, we would need twice
the sample size.
The formula, in general, assuming p1 = p2 = p:
$$ n=\frac {2p(1-p)Z^2} {e^2} ,\;e=Z \sqrt {\frac {2p(1-p)}{n}}$$
The required sample size at confidence level of 95%, across different
margins of error, for differences in proportions, is shown in
Exhibit 35.6.
In order to manage costs, continuous tracking studies often employ 8-weekly
or 4-weekly rolling averages to track metrics. This approach helps reduce the required sample
sizes to a range of 50 to 100 per wave, typically on a weekly basis. However, a drawback of
using rolling averages is that they tend to smooth out the data, making it harder to detect
subtle changes or variations.
Alternatively, dipstick studies may by conducted at less frequent
intervals with larger samples that reveal changes more distinctly. Since they provide a
snapshot in time, dipsticks are better suited for tracking the “before” and “after” impact
of a marketing initiative. However, they are not typically recommended for tracking ongoing
changes in the market for research programmes like advertising tracking where several brands
have campaigns running across multiple media through the course of the year. For such studies,
continuous tracking is better suited as it allows for establishing baselines, capturing the
ongoing nature of marketing activities, and assessing their impact in the marketplace.