
-
Social Media Analytics
Social Media Analytics
Why Social Media Matters for Brands
Insights Gleaned from Social Media Platforms
Strengths of Social Media Data
Limitations of Social Media Data
Understanding Social Data
Social Media Platforms: Key Features
Structured and Unstructured-Data
Social Data Mining
Social Data Mining Process
Social Data Mining Techniques
Social Data Mining Challenges
Application Programming Interfaces
How APIs Work
Working with APIs
Endpoints
Twitter (X) API
Twitter (X) API — Securing Access
Twitter (X) REST API in Python
Facebook API
Facebook Graph API
Facebook API — Securing Access
Facebook API in Python
Advantages and Limitations of APIs
Data Cleaning Techniques
Natural Language Processing
Natural Language Toolkit (NLTK)
Social Media Data Types
Textual Data Encoding
Text Processing Techniques
Tokenization
Word Tokenization
Character Tokenization
Sub-Word Tokenization
Stemming and Lemmatization
Stemming
Lemmatization
Stemming and Lemmatization in Python
N-grams, Bigrams, and Trigrams
Applications of N-grams
Applications of N-grams in Sentiment Analysis
Topic Modelling with N-grams
Vectorization
Bag-of-Words
TF-IDF Vectorizer
Facebook Brand Page Analysis
Extracting Insights from Facebook Brand Pages
Facebook — Social Data Analysis Process
Facebook — Data Extraction
Text Analytics
Text Analytics Process
Part of Speech (POS) Tagging
Noun Phrases
Text Data Processing in Python
Word Cloud (FB data) in Python
Time Series Analysis and Visualization of FB Comments
Emotion Analysis
IBM Watson Natural Language Understanding
Accessing IBM Cloud Services
Emotion Analysis Using Watson NLU
Sentiment Analysis
Forms of Sentiment Analysis
Types of Sentiment Analysis
Visual Sentiment Analysis and Facial Coding
Applications of Facial Coding
Sentiment Analysis in Text
Analysis of Behaviours and Sentiments
Sentiment Analysis Process
Sentiment Analysis — Classification
VADER Classifier
Standard Sentiment Analysis
Customised Sentiment Analysis
Model Validation – Confusion Matrix
K-fold Cross-validation
Named Entity Recognition (NER)
NER Process Overview
Stanford NER
Challenges in NER
Stanford NER Implementation in Python
Web Scraping
Web Scraping Techniques
Applications of Web Scraping
Legal and Ethical Considerations
Beautiful Soup
Scraping Quotes to Scrape
Scraping of Fake Jobs Webpage
Scrapy
Scrapy Concepts
Scrapy Framework
Scrapy Limitations
Beautiful Soup vs. Scrapy — A Comparison
Selenium
Topic Modelling
Topic Modelling — Illustration
Topic Modelling Techniques
Topic Modelling Process
Latent Dirichlet Allocation (LDA) Model
Topic Modelling Tweets with LDA in Python
Social Influence on Social Media
Key Forms of Social Influence
Social Influence on Social Media Platforms
Examples of Organized Social Influence
Social Network Analysis
Topic Networks and User Networks
Online Social Networks — The Basics
Analysing Topic Networks
Centrality Measures
Degree Centrality
Betweenness Centrality
Closeness Centrality
Eigenvector Centrality
Use Case — Marketing Analytics Topic Network
Social Network Analysis Process
SNA — Uncovering User Communities
Appendix — Python Basics: Tutorial
Installation — Anaconda, Jupyter and Python
Python Syntax
Variables
Data Types
If Else Statement
While and For Loops
Functions (def)
Lambda Functions
Modules
JSON
Python Requests — get(), json()
User Input
Exercises
Appendix — Python Pandas
Basic Usage
Reading, Writing and Viewing Data
Data Cleaning
Other Features
Appendix — Python Visualization
Matplotlib
Matplotlib — Basic Plotting
NumPy
Matplotlib — Beyond Lines
Analysis and Visualization of the Iris Dataset
Word Clouds
Word Cloud in Python
Seaborn — Statistical Data Visualization
Seaborn Visualization in Python
Appendix — Scrapy Tutorial
Creating a Project
Writing a Spider
Running the Spider
Extracting Data
Extracting Data — CSS Method
Extracting Data — XPath Method
Extracting Quotes and Authors
Extracting Data in Spider
Storing the Scraped Data
Pipeline
Following Links
Appendix — HTML Basics
HTML Tree Structure, Tags and Attributes
Tags
Attributes
My First Webpage
- New Media
- Digital Marketing
- YouTube
- Social Media Analytics
- SEO
- Search Advertising
- Web Analytics
- Execution
- Case — Prop-GPT
- Marketing Education
- Is Marketing Education Fluffy and Weak?
- How to Choose the Right Marketing Simulator
- Self-Learners: Experiential Learning to Adapt to the New Age of Marketing
- Negotiation Skills Training for Retailers, Marketers, Trade Marketers and Category Managers
- Simulators becoming essential Training Platforms
- What they SHOULD TEACH at Business Schools
- Experiential Learning through Marketing Simulators
-
MarketingMind
Social Media Analytics
Social Media Analytics
Why Social Media Matters for Brands
Insights Gleaned from Social Media Platforms
Strengths of Social Media Data
Limitations of Social Media Data
Understanding Social Data
Social Media Platforms: Key Features
Structured and Unstructured-Data
Social Data Mining
Social Data Mining Process
Social Data Mining Techniques
Social Data Mining Challenges
Application Programming Interfaces
How APIs Work
Working with APIs
Endpoints
Twitter (X) API
Twitter (X) API — Securing Access
Twitter (X) REST API in Python
Facebook API
Facebook Graph API
Facebook API — Securing Access
Facebook API in Python
Advantages and Limitations of APIs
Data Cleaning Techniques
Natural Language Processing
Natural Language Toolkit (NLTK)
Social Media Data Types
Textual Data Encoding
Text Processing Techniques
Tokenization
Word Tokenization
Character Tokenization
Sub-Word Tokenization
Stemming and Lemmatization
Stemming
Lemmatization
Stemming and Lemmatization in Python
N-grams, Bigrams, and Trigrams
Applications of N-grams
Applications of N-grams in Sentiment Analysis
Topic Modelling with N-grams
Vectorization
Bag-of-Words
TF-IDF Vectorizer
Facebook Brand Page Analysis
Extracting Insights from Facebook Brand Pages
Facebook — Social Data Analysis Process
Facebook — Data Extraction
Text Analytics
Text Analytics Process
Part of Speech (POS) Tagging
Noun Phrases
Text Data Processing in Python
Word Cloud (FB data) in Python
Time Series Analysis and Visualization of FB Comments
Emotion Analysis
IBM Watson Natural Language Understanding
Accessing IBM Cloud Services
Emotion Analysis Using Watson NLU
Sentiment Analysis
Forms of Sentiment Analysis
Types of Sentiment Analysis
Visual Sentiment Analysis and Facial Coding
Applications of Facial Coding
Sentiment Analysis in Text
Analysis of Behaviours and Sentiments
Sentiment Analysis Process
Sentiment Analysis — Classification
VADER Classifier
Standard Sentiment Analysis
Customised Sentiment Analysis
Model Validation – Confusion Matrix
K-fold Cross-validation
Named Entity Recognition (NER)
NER Process Overview
Stanford NER
Challenges in NER
Stanford NER Implementation in Python
Web Scraping
Web Scraping Techniques
Applications of Web Scraping
Legal and Ethical Considerations
Beautiful Soup
Scraping Quotes to Scrape
Scraping of Fake Jobs Webpage
Scrapy
Scrapy Concepts
Scrapy Framework
Scrapy Limitations
Beautiful Soup vs. Scrapy — A Comparison
Selenium
Topic Modelling
Topic Modelling — Illustration
Topic Modelling Techniques
Topic Modelling Process
Latent Dirichlet Allocation (LDA) Model
Topic Modelling Tweets with LDA in Python
Social Influence on Social Media
Key Forms of Social Influence
Social Influence on Social Media Platforms
Examples of Organized Social Influence
Social Network Analysis
Topic Networks and User Networks
Online Social Networks — The Basics
Analysing Topic Networks
Centrality Measures
Degree Centrality
Betweenness Centrality
Closeness Centrality
Eigenvector Centrality
Use Case — Marketing Analytics Topic Network
Social Network Analysis Process
SNA — Uncovering User Communities
Appendix — Python Basics: Tutorial
Installation — Anaconda, Jupyter and Python
Python Syntax
Variables
Data Types
If Else Statement
While and For Loops
Functions (def)
Lambda Functions
Modules
JSON
Python Requests — get(), json()
User Input
Exercises
Appendix — Python Pandas
Basic Usage
Reading, Writing and Viewing Data
Data Cleaning
Other Features
Appendix — Python Visualization
Matplotlib
Matplotlib — Basic Plotting
NumPy
Matplotlib — Beyond Lines
Analysis and Visualization of the Iris Dataset
Word Clouds
Word Cloud in Python
Seaborn — Statistical Data Visualization
Seaborn Visualization in Python
Appendix — Scrapy Tutorial
Creating a Project
Writing a Spider
Running the Spider
Extracting Data
Extracting Data — CSS Method
Extracting Data — XPath Method
Extracting Quotes and Authors
Extracting Data in Spider
Storing the Scraped Data
Pipeline
Following Links
Appendix — HTML Basics
HTML Tree Structure, Tags and Attributes
Tags
Attributes
My First Webpage
- New Media
- Digital Marketing
- YouTube
- Social Media Analytics
- SEO
- Search Advertising
- Web Analytics
- Execution
- Case — Prop-GPT
- Marketing Education
- Is Marketing Education Fluffy and Weak?
- How to Choose the Right Marketing Simulator
- Self-Learners: Experiential Learning to Adapt to the New Age of Marketing
- Negotiation Skills Training for Retailers, Marketers, Trade Marketers and Category Managers
- Simulators becoming essential Training Platforms
- What they SHOULD TEACH at Business Schools
- Experiential Learning through Marketing Simulators
Model Validation – Confusion Matrix
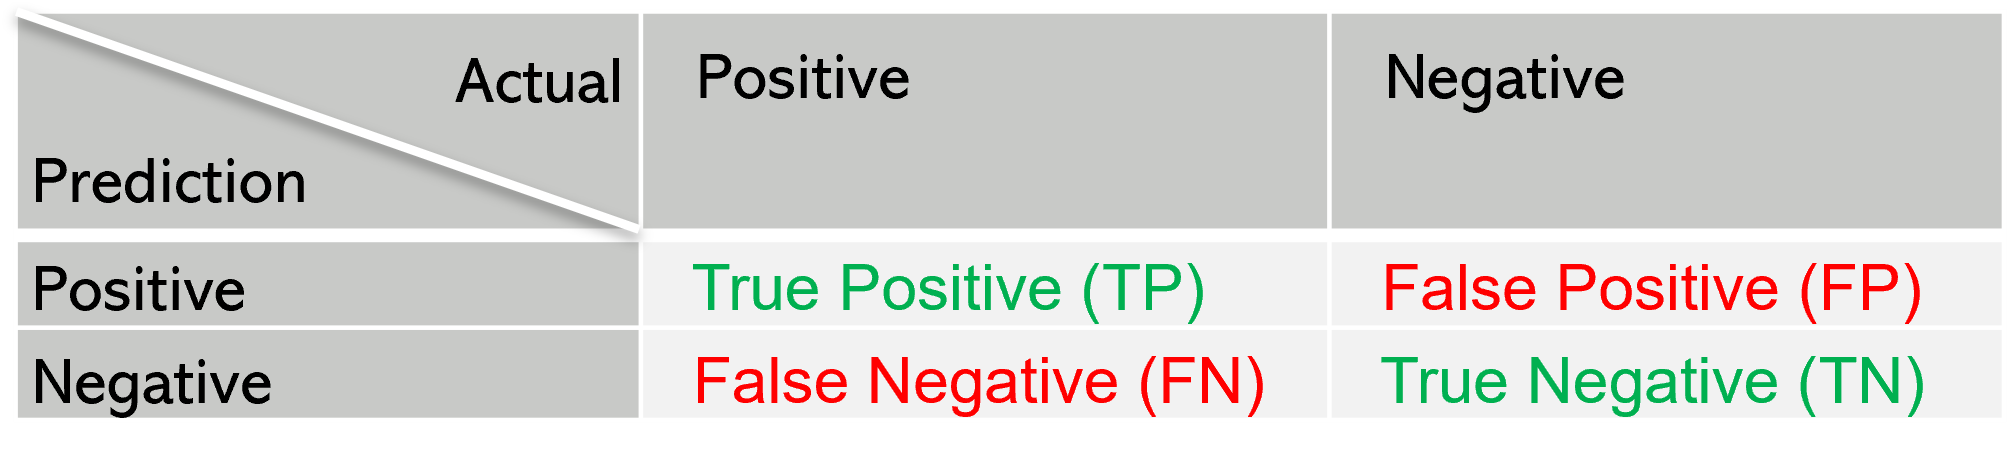
Exhibit 25.29 Confusion matrix.
A confusion matrix is a vital tool in the evaluation of classification models in machine learning. It provides a comprehensive visualization of a model's performance by presenting the number of correct and incorrect predictions compared to the actual outcomes (ground truth) in a structured tabular format. This matrix is particularly useful when analysing the efficacy of a model and understanding the types of errors it makes.
Structure of the Confusion Matrix
The confusion matrix consists of four key components:
- True Positive (TP): The number of instances where the model correctly predicted the positive class.
- False Positive (FP): The number of instances where the model incorrectly predicted the positive class when the actual class was negative (also known as a Type I error).
- True Negative (TN): The number of instances where the model correctly predicted the negative class.
- False Negative (FN): The number of instances where the model incorrectly predicted the negative class when the actual class was positive (also known as a Type II error).
These four components form the basis of several important performance metrics.
Key Metrics Derived from the Confusion Matrix
- Accuracy:
Accuracy measures the overall correctness of the model. It is calculated as the ratio of correct predictions (both TP and TN) to the total number of predictions. \[ \text{Accuracy} = \frac{TP + TN}{TP + FP + TN + FN} \] While accuracy is useful, it may not be a reliable metric in cases of imbalanced datasets.
- Precision:
Precision quantifies the proportion of true positive predictions among all positive predictions made by the model. \[ \text{Precision} = \frac{TP}{TP + FP} \]
Precision is crucial when false positives are costly. For example, in a medical diagnosis for a serious disease, a false positive could lead to unnecessary stress and expensive treatments.
In the context of a court trial, precision would measure the proportion of people predicted as guilty who are actually guilty. A low precision means a high number of false positives (wrongful convictions), which can have severe ethical, legal, and personal consequences.
When the dataset is imbalanced (i.e., there are significantly more negatives than positives), accuracy can be misleading. Precision ensures that we focus on correctly identifying the positive cases without misclassifying too many negatives as positives.
In search engines or recommendation systems, a high precision score, ensures that the retrieved or recommended items are truly relevant to the user, avoiding irrelevant suggestions.
- Recall (Sensitivity or True Positive Rate):
Recall measures the proportion of actual positive instances that were correctly identified by the model. \[ \text{Recall} = \frac{TP}{TP + FN} \]
Recall focuses on how many actual positive cases were correctly identified out of all actual positives. It is crucial when missing a positive case (false negative) has severe consequences.
For example, in the context of cancer diagnosis, if recall is low, it means the model misses many actual cancer cases, leading to false negatives, where patients with cancer are wrongly told they are healthy. This is extremely dangerous because delayed or missed treatment can allow the cancer to progress, potentially becoming untreatable.
- F1 Score:
\[
\text{F1 Score} = 2 \times \frac{\text{Precision} \times \text{Recall}}{\text{Precision} + \text{Recall}}
\]
The F1 Score is the harmonic mean of precision and recall, providing a single metric that balances both concerns. It is particularly valuable when there is an uneven class distribution or when precision and recall are both critical. (The harmonic mean is a numerical average calculated by dividing the number of observations, or entries in the series, by the reciprocal of each number in the series. Thus, the harmonic mean is the reciprocal of the arithmetic mean of the reciprocals).
- Specificity (True Negative Rate):
Specificity assesses the proportion of actual negative instances that were correctly identified by the model. It answers the question: Out of all actual negative cases, how many were correctly identified as negative? \[ \text{Specificity} = \frac{TN}{TN + FP} \]
It is particularly important in cases where false positives (incorrectly classifying a negative as positive) have serious consequences.
In the context of medical diagnosis, specificity measures how well the model correctly identifies healthy individuals (TN) and avoids false alarms (FP).
Importance of the Confusion Matrix
Confusion matrices are indispensable for evaluating the performance of classification models, especially in situations where the class distribution is imbalanced or when different types of errors have varying implications. By analysing the confusion matrix, practitioners can gain insights into the model’s strengths and weaknesses, leading to more informed decisions about model refinement or the need for additional data.
Previous Next
Use the Search Bar to find content on MarketingMind.


Contact | Privacy Statement | Disclaimer: Opinions and views expressed on www.ashokcharan.com are the author’s personal views, and do not represent the official views of the National University of Singapore (NUS) or the NUS Business School | © Copyright 2013-2026 www.ashokcharan.com. All Rights Reserved.