
-
Sales & Distribution
Sales and Distribution
Interdependence of Demand and Supply
Components of Sales — Width & Depth
Measures of Distribution (Width)
Sales and Distribution Priorities
Distribution Network — Basics
Relationship between Sales and Distribution
Right Channels, Right Chains
Right Assortment
Managing Assortment
Battle of Shelf Space
Measures of Assortment and Sales Velocity
Number of Items Stocked
Assortment Analysis
Sales per Point of Weighted Distribution
Share in Handlers
Average Sales per Store
Rate of Sales
Rate of Sales/Gross Profit
Portfolio Analysis
Fragmentation Analysis
Securing Retailer Support
Managing Stock in Trade
Allocation of Shelf Space
Cost of Stockouts
- Retail Tracking
- Sales and Distribution
- Retail Analytics
- Category Management
- Marketing Education
- Is Marketing Education Fluffy and Weak?
- How to Choose the Right Marketing Simulator
- Self-Learners: Experiential Learning to Adapt to the New Age of Marketing
- Negotiation Skills Training for Retailers, Marketers, Trade Marketers and Category Managers
- Simulators becoming essential Training Platforms
- What they SHOULD TEACH at Business Schools
- Experiential Learning through Marketing Simulators
-
MarketingMind
Sales & Distribution
Sales and Distribution
Interdependence of Demand and Supply
Components of Sales — Width & Depth
Measures of Distribution (Width)
Sales and Distribution Priorities
Distribution Network — Basics
Relationship between Sales and Distribution
Right Channels, Right Chains
Right Assortment
Managing Assortment
Battle of Shelf Space
Measures of Assortment and Sales Velocity
Number of Items Stocked
Assortment Analysis
Sales per Point of Weighted Distribution
Share in Handlers
Average Sales per Store
Rate of Sales
Rate of Sales/Gross Profit
Portfolio Analysis
Fragmentation Analysis
Securing Retailer Support
Managing Stock in Trade
Allocation of Shelf Space
Cost of Stockouts
- Retail Tracking
- Sales and Distribution
- Retail Analytics
- Category Management
- Marketing Education
- Is Marketing Education Fluffy and Weak?
- How to Choose the Right Marketing Simulator
- Self-Learners: Experiential Learning to Adapt to the New Age of Marketing
- Negotiation Skills Training for Retailers, Marketers, Trade Marketers and Category Managers
- Simulators becoming essential Training Platforms
- What they SHOULD TEACH at Business Schools
- Experiential Learning through Marketing Simulators
Managing Stock in Trade
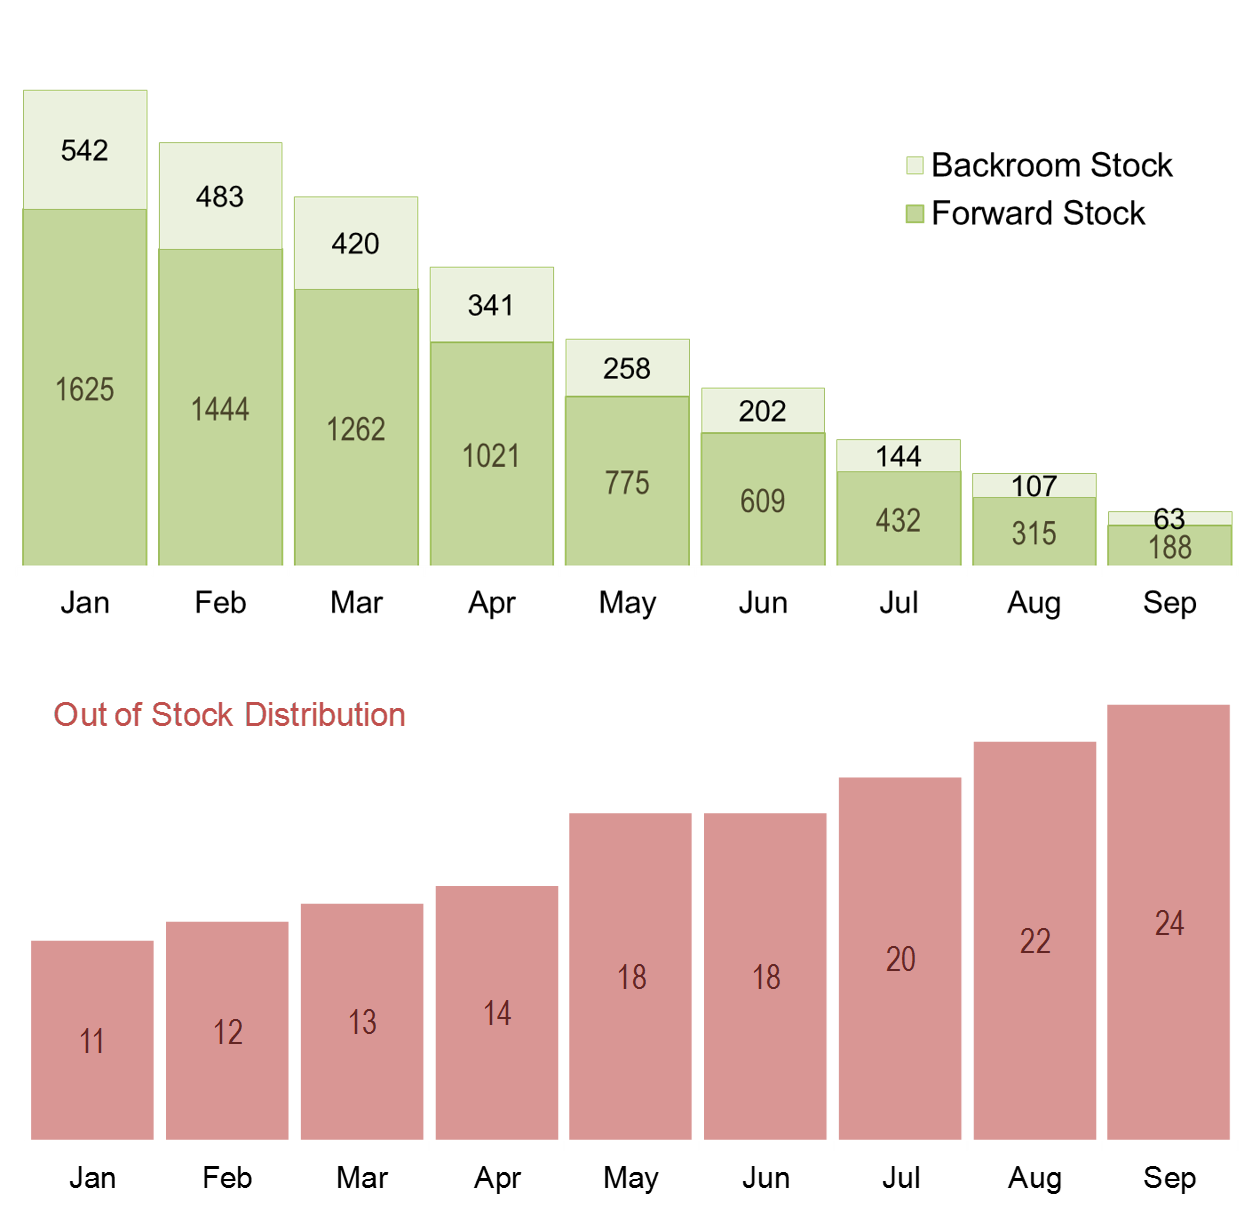
Exhibit 31.12 Declining forward and backroom stock, and growth in the incidence of stockouts are indicators of supply issues or loss of distribution
The following metrics are useful in managing stocks in the lower trade segment:
- Forward stock: This refers to stock in the store’s selling area which can easily be accessed by customers. It includes stock placed on shelves, special displays, shop floor space, chillers, freezers, cabinets, and other visible areas.
- Total stock: This represents the sum of stock in the store’s selling area and the backroom or storeroom.
- Stock cover (stock cover days): This metric calculates the number of days that the available stock would last, assuming sales continue at the same rate. It provides an estimate of inventory sufficiency.
- Out of stock: This measures the percentage of stores handling the product during the reporting period but having no stock available at the time of stock count. It indicates instances where demand exceeds supply.
These metrics are commonly used in the lower trade (non-scan) channels, and retail audit data supports their analysis. While some retailers in scan channels track these metrics, the information may not be readily available. However, with the adoption of technologies like radio frequency identification (RFID) tags, collating and maintaining such information will become easier in certain sectors.
Declining forward stock and an increase in stockouts are warning signs that both manufacturers and retailers should pay attention to. These metrics indicate potential supply issues or a loss of distribution.
It is important for stock cover to be significantly greater than the manufacturer’s sales cycle or the retailer’s procurement cycle. If stock cover days fall below the average sales cycle, the incidence of stockouts will soar.
Observing trends in forward stock and the distribution of stockouts can reveal supply and stock management issues within the trade. For example, Exhibit 31.12 illustrates a brand experiencing supply shortages, leading to a reduction in inventory and a high frequency of stockouts. Between January and September, the stock levels in the channel decreased from 2,176 units to just 251 units, while stockouts rose from 11% to 24% during the same period.
By monitoring and analysing these metrics, manufacturers and retailers can identify potential challenges and take proactive measures to improve stock management and ensure adequate supply to meet customer demand.
Previous Next
Use the Search Bar to find content on MarketingMind.
Online Apps to train Category Managers
The Plannogrammer is an experiential learning facility for category managers, trade marketers, and retailers in consumer markets. Ideally suited for hybrid learning programmes, Plannogrammer imparts hands-on training in the planning and evaluation of promotions and merchandising.
It supports a collection of simulation and analysis platforms such as Promotions and Space Planner for optimizing space and promotions, Plannogram for populating shelves and merchandising, a Due To Analysis dashboard that decomposes brand sales into the factors driving sales, and a Promotion Evaluator to evaluate the volume, value and profit impact of promotion plans.


Contact | Privacy Statement | Disclaimer: Opinions and views expressed on www.ashokcharan.com are the author’s personal views, and do not represent the official views of the National University of Singapore (NUS) or the NUS Business School | © Copyright 2013-2026 www.ashokcharan.com. All Rights Reserved.