| Weighted Distribution | Numeric Distribution |
|---|
| Outrageous Orange | 78 | 62 |
|---|
| Cheeky Cherryade | 87 | 70 |
|---|
| Ice Cream Soda | 82 | 67 |
|---|
| Original Sarsi | 80 | 65 |
|---|
| Fruitade | 72 | 58 |
|---|
| Groovy Grape | 64 | 47 |
|---|
| Zesty Zappel | 62 | 40 |
|---|
Exhibit 31.9 Weighted and numeric distribution of the flavours of
Rainbow, a soft drink brand. The brand’s overall numeric distribution is 85%.
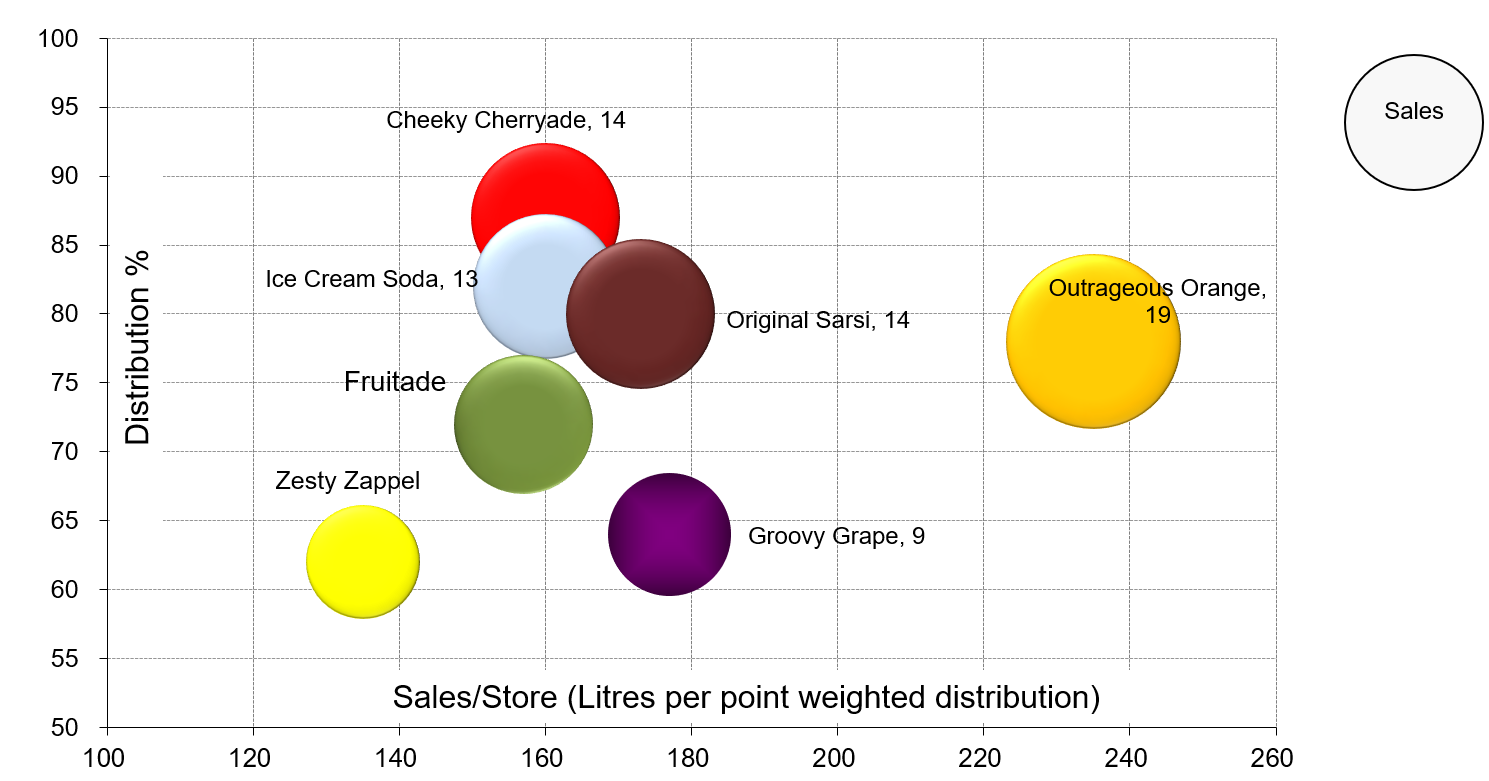
Exhibit 31.10 Weighted distribution and sales per point of
distribution for Rainbow’s portfolio of flavours. Label = sales value in $’000.
Exhibits 31.9 and 31.10 provide a
visual representation of the portfolio of Rainbow, a soft drink brand, in a lower trade
channel. Based on the brand’s overall numeric distribution (85%) and the numeric distribution
of its variants, the depth of distribution is 4.8, indicating that the average store carrying
Rainbow stocks 4.8 out of the 7 variants available.
The portfolio analysis in the exhibit suggests the
need to expand the distribution of Outrageous Orange and Groovy Grape.
Distribution should be prioritized on the basis of Sales per Point of Weighted Distribution
(SPPD)SPPD. Other factors remaining constant, if a shop keeper wants to stock only one
flavour, it should preferably be orange, and if it is three, in that case — orange, grape and
Sarsi, since they exhibit the highest SPPD.