
-
Sales & Distribution
Sales and Distribution
Interdependence of Demand and Supply
Components of Sales — Width & Depth
Measures of Distribution (Width)
Sales and Distribution Priorities
Distribution Network — Basics
Relationship between Sales and Distribution
Right Channels, Right Chains
Right Assortment
Managing Assortment
Battle of Shelf Space
Measures of Assortment and Sales Velocity
Number of Items Stocked
Assortment Analysis
Sales per Point of Weighted Distribution
Share in Handlers
Average Sales per Store
Rate of Sales
Rate of Sales/Gross Profit
Portfolio Analysis
Fragmentation Analysis
Securing Retailer Support
Managing Stock in Trade
Allocation of Shelf Space
Cost of Stockouts
- Retail Tracking
- Sales and Distribution
- Retail Analytics
- Category Management
- Marketing Education
- Is Marketing Education Fluffy and Weak?
- How to Choose the Right Marketing Simulator
- Self-Learners: Experiential Learning to Adapt to the New Age of Marketing
- Negotiation Skills Training for Retailers, Marketers, Trade Marketers and Category Managers
- Simulators becoming essential Training Platforms
- What they SHOULD TEACH at Business Schools
- Experiential Learning through Marketing Simulators
-
MarketingMind
Sales & Distribution
Sales and Distribution
Interdependence of Demand and Supply
Components of Sales — Width & Depth
Measures of Distribution (Width)
Sales and Distribution Priorities
Distribution Network — Basics
Relationship between Sales and Distribution
Right Channels, Right Chains
Right Assortment
Managing Assortment
Battle of Shelf Space
Measures of Assortment and Sales Velocity
Number of Items Stocked
Assortment Analysis
Sales per Point of Weighted Distribution
Share in Handlers
Average Sales per Store
Rate of Sales
Rate of Sales/Gross Profit
Portfolio Analysis
Fragmentation Analysis
Securing Retailer Support
Managing Stock in Trade
Allocation of Shelf Space
Cost of Stockouts
- Retail Tracking
- Sales and Distribution
- Retail Analytics
- Category Management
- Marketing Education
- Is Marketing Education Fluffy and Weak?
- How to Choose the Right Marketing Simulator
- Self-Learners: Experiential Learning to Adapt to the New Age of Marketing
- Negotiation Skills Training for Retailers, Marketers, Trade Marketers and Category Managers
- Simulators becoming essential Training Platforms
- What they SHOULD TEACH at Business Schools
- Experiential Learning through Marketing Simulators
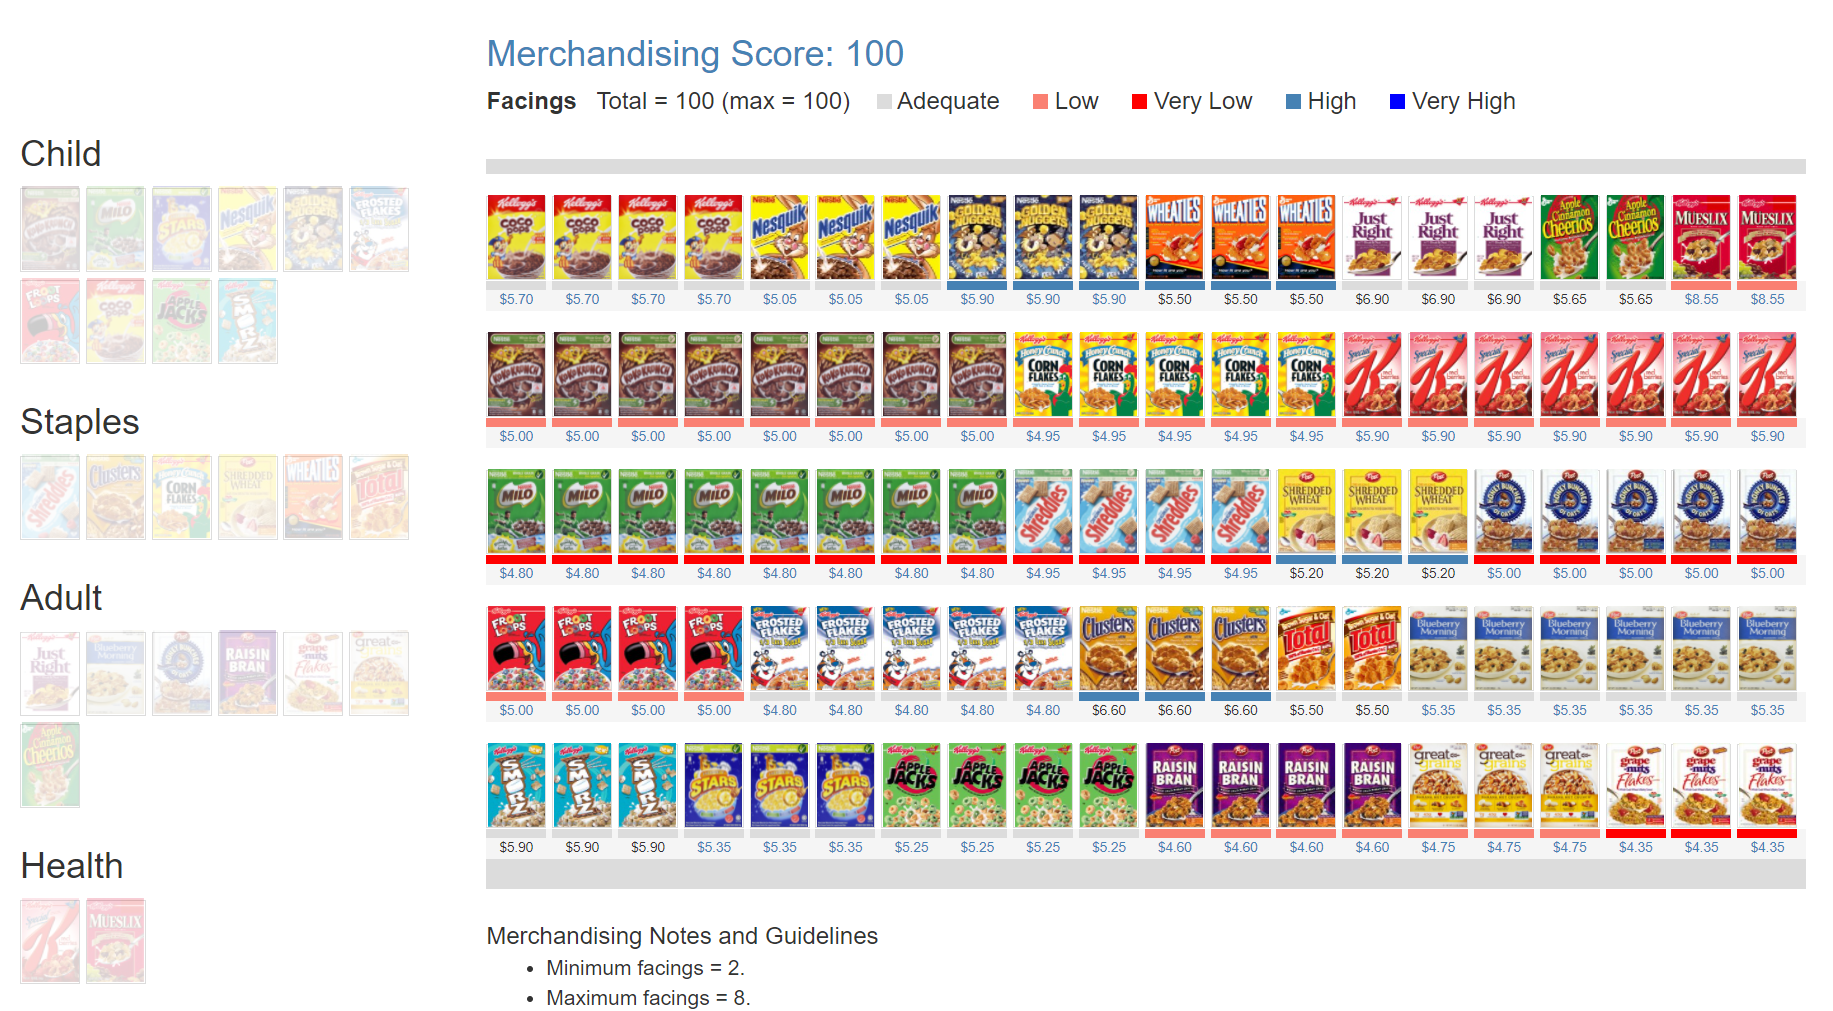
Managing Assortment — Number of Items Stocked
Brands Stocked in Store
For instance, consider a hypothetical example of flat screen TVs, which are available in 90% of stores that carry consumer durables. In this market, there are only three brands: Panasonic, Philips, and Sharp. Their presence in stores is as follows:
- Panasonic is in 60% of stores.
- Philips is in 40%.
- Sharp is in 80%.
Now, let us assume there are exactly 100 stores. This means that out of the 100 stores, 60 carry Panasonic, 40 carry Philips, and 80 carry Sharp. The cumulative distribution count for the three brands is 180 (60+40+80) across the 90 stores that carry flat screen TVs. Therefore, on average, each store carries 2 brands (180/90).
As the arithmetic demonstrates, the average number of brands stocked in stores (within a specific category) is calculated by summing up the numeric distribution of the brands and dividing it by the overall numeric distribution of the category: $$\frac{\text{Sum of Brands Distribution}}{\text{Product Category Distribution}}$$
- Sum of Brands Distribution: 60 + 40 + 80 =180
- Product Category Distribution: 90
- Average number of brands = 180/90 = 2
Items Stocked in Store
Similarly, the average number of items stocked in stores:
$$\frac{\text{Sum of Items Distribution}}{\text{Product Category Distribution}}$$Brand Range Stocked in Store
And the average number of a brand’s items stocked in the stores carrying the brand:
$$\frac{\text{Sum of Brand’s Items Distribution}}{\text{Brand Distribution}}$$Example: Let us consider, hypothetically, a brand that has a numeric distribution of 80% (width of distribution), meaning it is available in 80% of stores. Within those stores, the brand offers three different items, each with its own distribution: 80%, 50%, and 70%.
To compute the average number of items stocked in stores carrying the brand, we follow these steps:
- Calculate the sum of the brand’s items distribution:
80% + 50% + 70% = 200. - Determine the average number of items stocked (depth of distribution): $$\frac{\text{Sum of Brand’s Items Distribution}}{\text{Brand Distribution}}=\frac{200}{80}=2.5$$
Based on this calculation, on average, stores carrying the brand would stock approximately 2.5 of its items.
Previous Next
Use the Search Bar to find content on MarketingMind.
Online Apps to train Category Managers
The Plannogrammer is an experiential learning facility for category managers, trade marketers, and retailers in consumer markets. Ideally suited for hybrid learning programmes, Plannogrammer imparts hands-on training in the planning and evaluation of promotions and merchandising.
It supports a collection of simulation and analysis platforms such as Promotions and Space Planner for optimizing space and promotions, Plannogram for populating shelves and merchandising, a Due To Analysis dashboard that decomposes brand sales into the factors driving sales, and a Promotion Evaluator to evaluate the volume, value and profit impact of promotion plans.


Contact | Privacy Statement | Disclaimer: Opinions and views expressed on www.ashokcharan.com are the author’s personal views, and do not represent the official views of the National University of Singapore (NUS) or the NUS Business School | © Copyright 2013-2026 www.ashokcharan.com. All Rights Reserved.