
-
Sales & Distribution
Sales and Distribution
Interdependence of Demand and Supply
Components of Sales — Width & Depth
Measures of Distribution (Width)
Sales and Distribution Priorities
Distribution Network — Basics
Relationship between Sales and Distribution
Right Channels, Right Chains
Right Assortment
Managing Assortment
Battle of Shelf Space
Measures of Assortment and Sales Velocity
Number of Items Stocked
Assortment Analysis
Sales per Point of Weighted Distribution
Share in Handlers
Average Sales per Store
Rate of Sales
Rate of Sales/Gross Profit
Portfolio Analysis
Fragmentation Analysis
Securing Retailer Support
Managing Stock in Trade
Allocation of Shelf Space
Cost of Stockouts
- Retail Tracking
- Sales and Distribution
- Retail Analytics
- Category Management
- Marketing Education
- Is Marketing Education Fluffy and Weak?
- How to Choose the Right Marketing Simulator
- Self-Learners: Experiential Learning to Adapt to the New Age of Marketing
- Negotiation Skills Training for Retailers, Marketers, Trade Marketers and Category Managers
- Simulators becoming essential Training Platforms
- What they SHOULD TEACH at Business Schools
- Experiential Learning through Marketing Simulators
-
MarketingMind
Sales & Distribution
Sales and Distribution
Interdependence of Demand and Supply
Components of Sales — Width & Depth
Measures of Distribution (Width)
Sales and Distribution Priorities
Distribution Network — Basics
Relationship between Sales and Distribution
Right Channels, Right Chains
Right Assortment
Managing Assortment
Battle of Shelf Space
Measures of Assortment and Sales Velocity
Number of Items Stocked
Assortment Analysis
Sales per Point of Weighted Distribution
Share in Handlers
Average Sales per Store
Rate of Sales
Rate of Sales/Gross Profit
Portfolio Analysis
Fragmentation Analysis
Securing Retailer Support
Managing Stock in Trade
Allocation of Shelf Space
Cost of Stockouts
- Retail Tracking
- Sales and Distribution
- Retail Analytics
- Category Management
- Marketing Education
- Is Marketing Education Fluffy and Weak?
- How to Choose the Right Marketing Simulator
- Self-Learners: Experiential Learning to Adapt to the New Age of Marketing
- Negotiation Skills Training for Retailers, Marketers, Trade Marketers and Category Managers
- Simulators becoming essential Training Platforms
- What they SHOULD TEACH at Business Schools
- Experiential Learning through Marketing Simulators
Cash Rate of Sale, Rate of Gross Profit
The cash rate of sales, which refers to the rate of sales in value terms, and the rate of gross profit can be calculated as follows: $$ \text{Cash Rate of Sales = Selling Price × Rate of Sales} $$ $$ \text{Rate of Gross Sales = Margin × Cash Rate of Sales} $$
Unit, volume, value and profit are the different measures used to express the movement of goods. At an organization, the production, purchasing and logistics teams work with units. For instance, the factory manager for Nescafe needs to know how many jars of coffee need to be produced.
Volume, the measure for the size of the market, is of relevance to the marketing manager. For FMCG products kilogram or litre usually is appropriate.
Some products however are available in different forms. Coffee for instance is available in the form of powder and 3-in-1 sachets. The appropriate measure would be to translate the volume of these forms into an equivalent representing number of cups of coffee.
From a financial standpoint, sales value and profit are of prime importance. Money pays for raw materials and supplies, salaries, taxes, dividends and so on.
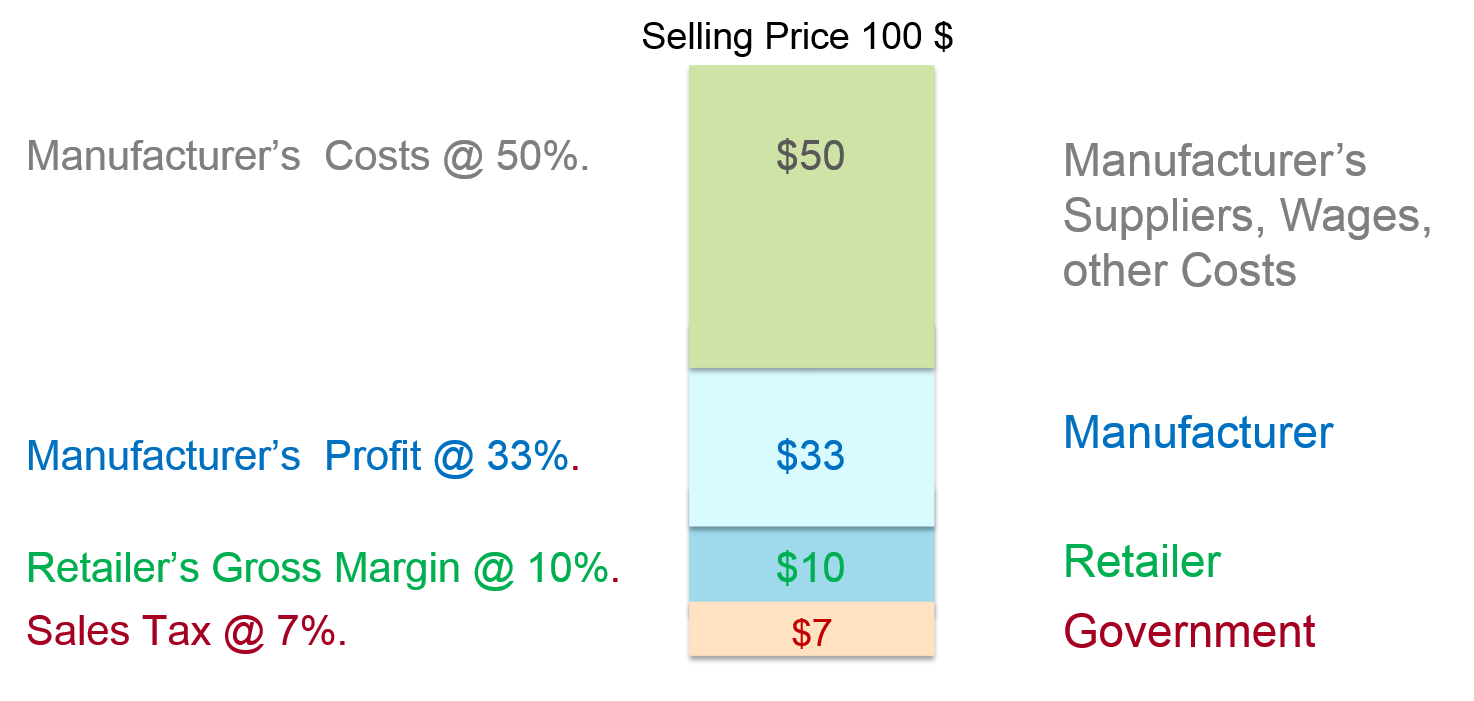
Exhibit 31.7 shows how the $100 selling price for a product gets distributed across the various stakeholders — manufacturer, retailer, suppliers and government. In this example the manufacturer makes a margin of 35%, and the retailer’s gross margin is 10%.
The metric turn × earn sums up the retailing business model, capturing the two main components of retailing — increasing the frequency of inventory turnover (turn) and maximizing margin (earn).
Turn is calculated by dividing the number of units sold by the average inventory (units). Earn is the gross margin.
Categories tend to vary from high-earn and low-turn to low-earn and high-turn. The margin for products with high-turn will tend to be lower than those with low-turn. In FMCG, for instance, retail margins vary from below 10% for fast moving categories like detergents, body wash and cooking oil to over 30% for low-turn products like facial care and expensive wines. This importantly also has a bearing on the roles that product categories, segments, and brands play within a retailer’s product portfolio.
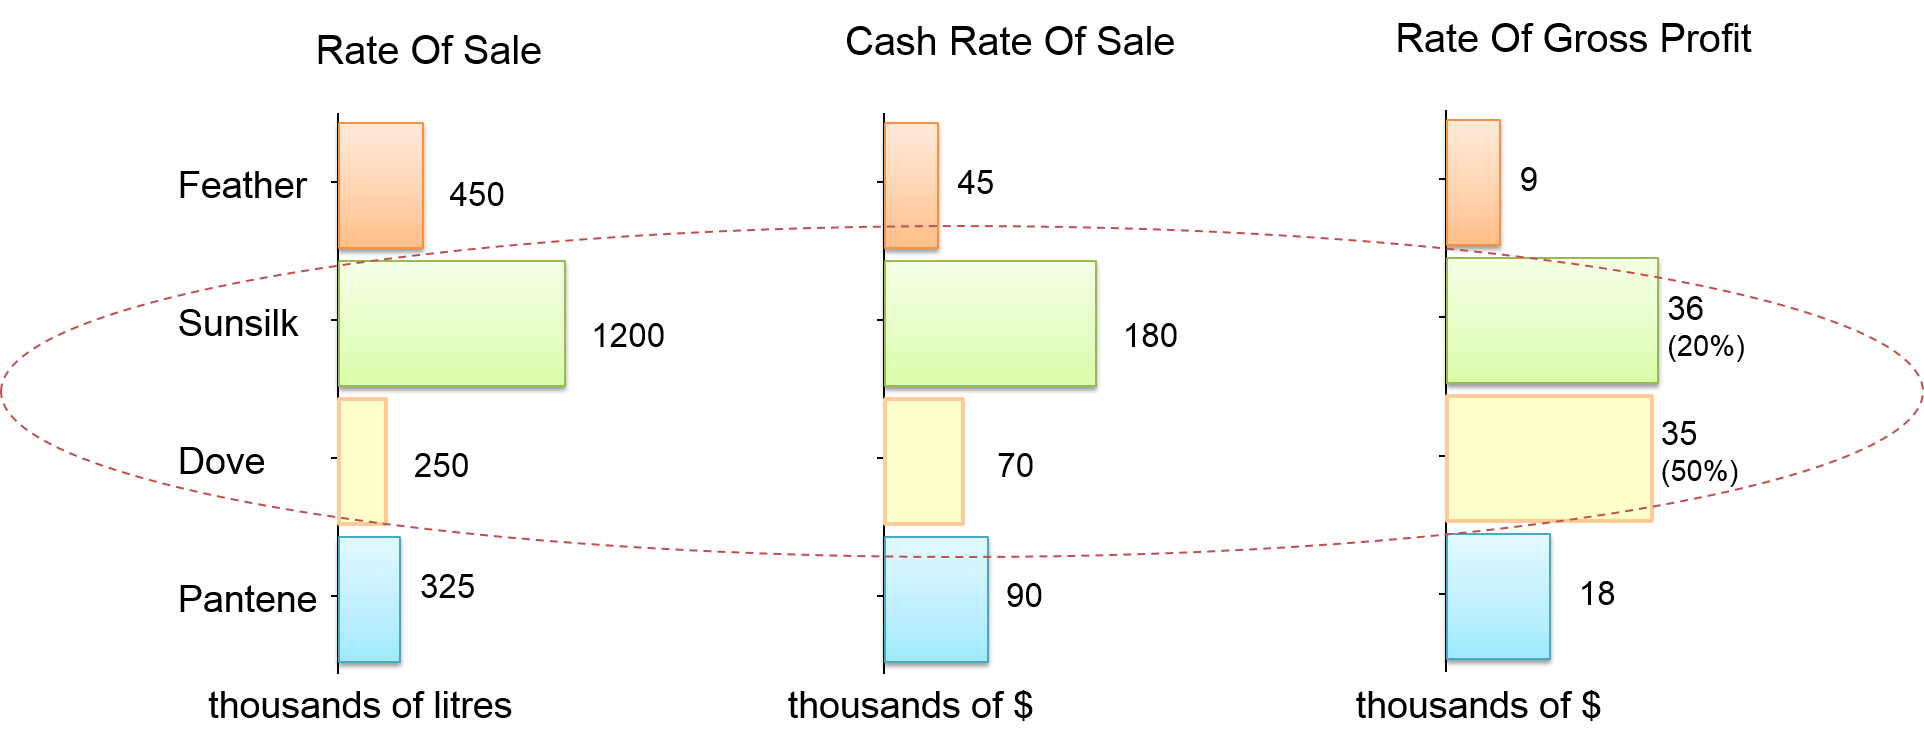
The example in Exhibit 31.8 illustrates the rate of sale and profit comparisons of four shampoo brands, revealing to the retailer the different roles that these brands are playing. Among the four, Sunsilk is the top brand consumed by shoppers and its gross profit is also greater than that for other brands. It can generate store traffic. Dove on the other hand, is a profit generator; its rate of gross profit is comparable to that for Sunsilk, despite much lower rate of sales.
Previous Next
Use the Search Bar to find content on MarketingMind.
Online Apps to train Category Managers
The Plannogrammer is an experiential learning facility for category managers, trade marketers, and retailers in consumer markets. Ideally suited for hybrid learning programmes, Plannogrammer imparts hands-on training in the planning and evaluation of promotions and merchandising.
It supports a collection of simulation and analysis platforms such as Promotions and Space Planner for optimizing space and promotions, Plannogram for populating shelves and merchandising, a Due To Analysis dashboard that decomposes brand sales into the factors driving sales, and a Promotion Evaluator to evaluate the volume, value and profit impact of promotion plans.


Contact | Privacy Statement | Disclaimer: Opinions and views expressed on www.ashokcharan.com are the author’s personal views, and do not represent the official views of the National University of Singapore (NUS) or the NUS Business School | © Copyright 2013-2026 www.ashokcharan.com. All Rights Reserved.