
-
Sales & Distribution
Sales and Distribution
Interdependence of Demand and Supply
Components of Sales — Width & Depth
Measures of Distribution (Width)
Sales and Distribution Priorities
Distribution Network — Basics
Relationship between Sales and Distribution
Right Channels, Right Chains
Right Assortment
Managing Assortment
Battle of Shelf Space
Measures of Assortment and Sales Velocity
Number of Items Stocked
Assortment Analysis
Sales per Point of Weighted Distribution
Share in Handlers
Average Sales per Store
Rate of Sales
Rate of Sales/Gross Profit
Portfolio Analysis
Fragmentation Analysis
Securing Retailer Support
Managing Stock in Trade
Allocation of Shelf Space
Cost of Stockouts
- Retail Tracking
- Sales and Distribution
- Retail Analytics
- Category Management
- Marketing Education
- Is Marketing Education Fluffy and Weak?
- How to Choose the Right Marketing Simulator
- Self-Learners: Experiential Learning to Adapt to the New Age of Marketing
- Negotiation Skills Training for Retailers, Marketers, Trade Marketers and Category Managers
- Simulators becoming essential Training Platforms
- What they SHOULD TEACH at Business Schools
- Experiential Learning through Marketing Simulators
-
MarketingMind
Sales & Distribution
Sales and Distribution
Interdependence of Demand and Supply
Components of Sales — Width & Depth
Measures of Distribution (Width)
Sales and Distribution Priorities
Distribution Network — Basics
Relationship between Sales and Distribution
Right Channels, Right Chains
Right Assortment
Managing Assortment
Battle of Shelf Space
Measures of Assortment and Sales Velocity
Number of Items Stocked
Assortment Analysis
Sales per Point of Weighted Distribution
Share in Handlers
Average Sales per Store
Rate of Sales
Rate of Sales/Gross Profit
Portfolio Analysis
Fragmentation Analysis
Securing Retailer Support
Managing Stock in Trade
Allocation of Shelf Space
Cost of Stockouts
- Retail Tracking
- Sales and Distribution
- Retail Analytics
- Category Management
- Marketing Education
- Is Marketing Education Fluffy and Weak?
- How to Choose the Right Marketing Simulator
- Self-Learners: Experiential Learning to Adapt to the New Age of Marketing
- Negotiation Skills Training for Retailers, Marketers, Trade Marketers and Category Managers
- Simulators becoming essential Training Platforms
- What they SHOULD TEACH at Business Schools
- Experiential Learning through Marketing Simulators
Sales and Distribution — Average Sales per Store
The average sales per store can be calculated by dividing the total sales volume by the number of stores distributing the product. The number of stores distributing the product is determined by multiplying the numeric distribution by the number of stores in the market universe. $$\text{Average Sales per Store}=\frac{\text{Sales Volume}}{\text{Number of stores distributing the product}}$$ $$\text{Number of stores distributing product = Numeric Distribution × # of stores in Universe}$$
For example, if the sales volume is 10,000 kg, the numeric distribution is 50%, and the number of stores in the market breakdown is 800, the average sales per store would be:
$$ Average \,Sales = \frac{10,000}{0.5 × 800} = \frac{10,000}{400} = 25 \,kg\,per\,store$$While this measure is simple and easy to understand, it can be misleading as it does not consider the quality of distribution. To illustrate this point, let us examine the following hypothetical data for Nescafe and Maxwell House.
Nescafe:
- Sold in 2,000 outlets,
- Average sales per store = 200 kg/month
Maxwell House:
- Sold in 100 outlets,
- Average sales per store = 300 kg/month
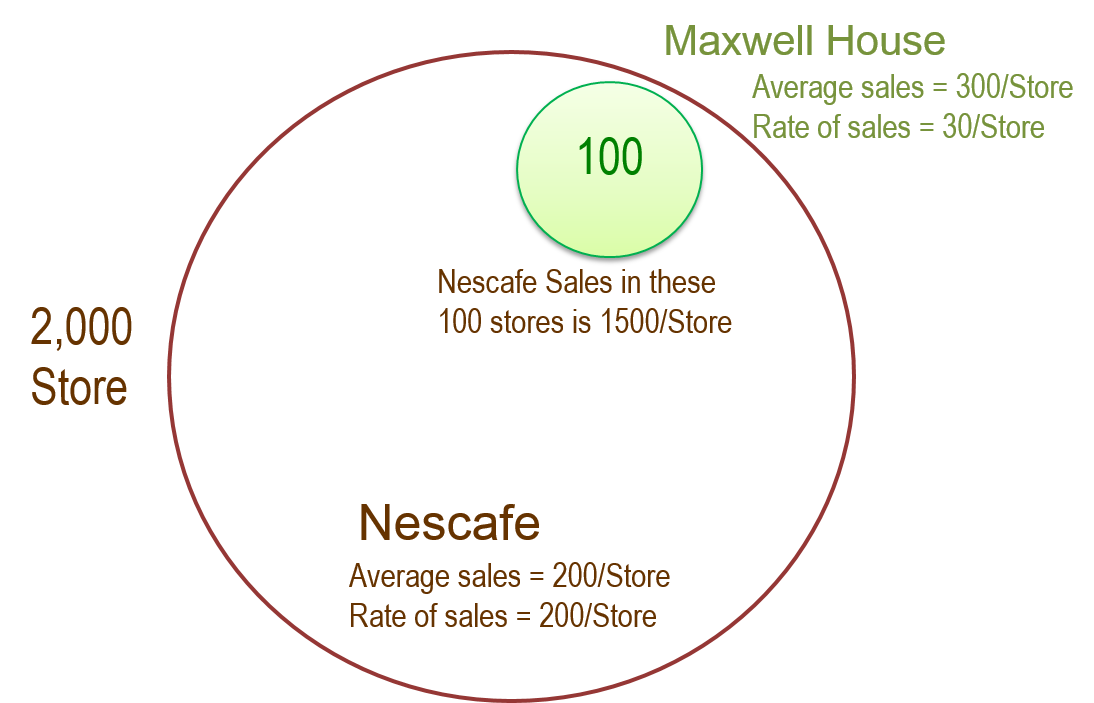
Based on average sales per store alone, it may seem that Maxwell House is selling at a faster pace than Nescafe. Intuitively, this does not sound right. Maxwell House’s distribution is confined to only 100 outlets, suggesting that it is a relatively small brand.
Upon filtering the data and drilling down to the 100 stores handling Maxwell House, we find that Nescafe is actually selling 1,500 kg per month in those stores (Exhibit 31.6), which is far greater than the average sales per store for Maxwell House.
This demonstrates that the average sales per store metric fails to account for the size of stores. This is a significant omission because smaller brands tend to be distributed only in larger stores that carry a wide assortment. As a brand grows and its distribution expands, its average sales per store tends to decrease as it moves into smaller stores.
Previous Next
Use the Search Bar to find content on MarketingMind.
Online Apps to train Trade Marketers
The Plannogrammer is an experiential learning facility for category managers, trade marketers, and retailers in consumer markets. Ideally suited for hybrid learning programmes, Plannogrammer imparts hands-on training in the planning and evaluation of promotions and merchandising.
It supports a collection of simulation and analysis platforms such as Promotions and Space Planner for optimizing space and promotions, Plannogram for populating shelves and merchandising, a Due To Analysis dashboard that decomposes brand sales into the factors driving sales, and a Promotion Evaluator to evaluate the volume, value and profit impact of promotion plans.


Contact | Privacy Statement | Disclaimer: Opinions and views expressed on www.ashokcharan.com are the author’s personal views, and do not represent the official views of the National University of Singapore (NUS) or the NUS Business School | © Copyright 2013-2026 www.ashokcharan.com. All Rights Reserved.