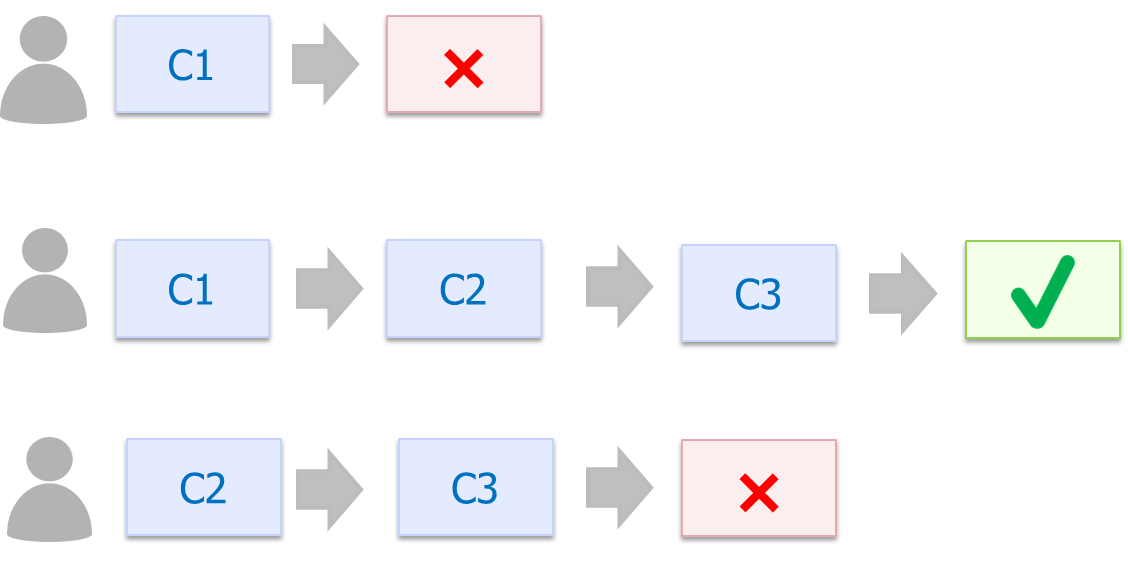
Exhibit 28.10 Customer journeys cutting across three channels — C1, C2 and C3.

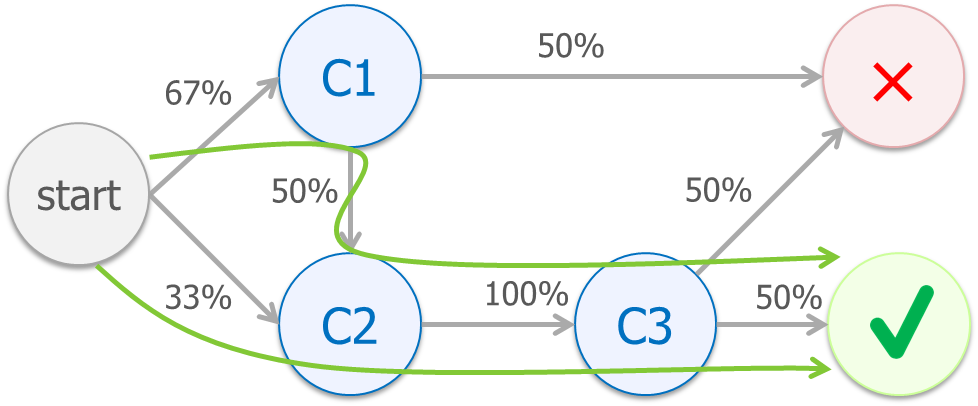
Exhibit 28.11 Markov chain for the customer journeys in Exhibit 28.10.
Heuristic attribution models based on thumb rules and gut-feels, though easy to
implement, are relatively inaccurate. For a more robust approach, marketers should consider probabilistic attribution
models. These models provide a better assessment of the marketing channels that drive sales.
One approach to a probabilistic-based solution is by means of the Markov chain,
a stochastic model describing a sequence of possible events. The model assumes that what happens
next in the chain of events depends only on the current state of the system.
Markov chain models are well suited for modelling customer journeys that follow a
chain of linked events and are increasingly used for the attribution of sales across marketing
channels.
A customer journey may be viewed as a sequence of touchpoints as shown in Exhibit
28.10. The touchpoints may be linked in a chain such as the one in Exhibit 27.11, where the
nodes represent marketing initiatives or marketing channels, and the links represent the
probability of transition between the initiatives/channels.
The set of three customer journeys shown in Exhibit 28.10 are modelled
in Exhibit 28.11, as a Markov chain with six different states: start, C1, C2, C3,
✗ (null) and ✓ (conversion). As can be seen from the Markov chain, two paths lead
to conversion, and the conversion probability is 33%:
$$\large{Conversion \, probability = (0.67×0.5×1×0.5)\\+(0.33×1×0.5)=0.33=33\%}$$
In this example, channel C1 influences one of the conversions (50% of the
total), whereas C2 and C3 lie in the path of all conversions (100%). Therefore,
C2 and C3 have double the weight of C1, and the Markov chain model
accordingly attributes channels C1, C2 and C3 in the ratio 20%, 40%, and
40% respectively.