-
Web Analytics
Web Analytics
Data Collection — Server Logs
Server Logs — Drawbacks
Page Caching by ISP
Dynamic IP Address
Proxy Servers
How Proxy Servers bypass Filters and Censorship
Data Collection — Page Tagging (JavaScript)
Cookie
Drawbacks of using Cookies for Tracking Users (Visitors)
Data Collection — Authentication Systems
Landing and Exit Pages
Metrics
Time Duration, Pages/Session and Engagement
TimeMe.js (GitHub)
Bounce Rate
Share of Voice for Search
Conversion and Conversion Path
Conversion Attribution Models
Markov Chain — Probabilistic Data-Driven Attribution
Google Analytics
Mobile Analytics
Global Positioning System (GPS)
Mobile Apps
Industry Benchmarks and Competitive Intelligence
Panel based data collection
Browser Toolbars
Optimize
Controlled Website Tests
Multivariate testing
A/B testing and Google Optimize
Web Analytics — Exercise
- New Media
- Digital Marketing
- YouTube
- Social Media Analytics
- SEO
- Search Advertising
- Web Analytics
- Execution
- Case — Prop-GPT
- Marketing Education
- Is Marketing Education Fluffy and Weak?
- How to Choose the Right Marketing Simulator
- Self-Learners: Experiential Learning to Adapt to the New Age of Marketing
- Negotiation Skills Training for Retailers, Marketers, Trade Marketers and Category Managers
- Simulators becoming essential Training Platforms
- What they SHOULD TEACH at Business Schools
- Experiential Learning through Marketing Simulators
-
MarketingMind
Web Analytics
Web Analytics
Data Collection — Server Logs
Server Logs — Drawbacks
Page Caching by ISP
Dynamic IP Address
Proxy Servers
How Proxy Servers bypass Filters and Censorship
Data Collection — Page Tagging (JavaScript)
Cookie
Drawbacks of using Cookies for Tracking Users (Visitors)
Data Collection — Authentication Systems
Landing and Exit Pages
Metrics
Time Duration, Pages/Session and Engagement
TimeMe.js (GitHub)
Bounce Rate
Share of Voice for Search
Conversion and Conversion Path
Conversion Attribution Models
Markov Chain — Probabilistic Data-Driven Attribution
Google Analytics
Mobile Analytics
Global Positioning System (GPS)
Mobile Apps
Industry Benchmarks and Competitive Intelligence
Panel based data collection
Browser Toolbars
Optimize
Controlled Website Tests
Multivariate testing
A/B testing and Google Optimize
Web Analytics — Exercise
- New Media
- Digital Marketing
- YouTube
- Social Media Analytics
- SEO
- Search Advertising
- Web Analytics
- Execution
- Case — Prop-GPT
- Marketing Education
- Is Marketing Education Fluffy and Weak?
- How to Choose the Right Marketing Simulator
- Self-Learners: Experiential Learning to Adapt to the New Age of Marketing
- Negotiation Skills Training for Retailers, Marketers, Trade Marketers and Category Managers
- Simulators becoming essential Training Platforms
- What they SHOULD TEACH at Business Schools
- Experiential Learning through Marketing Simulators
Google Analytics
Exhibit 28.12 Video demonstration of Google Analytics (GA4).
Google Analytics is a powerful and versatile platform for web analytics. For a demo of GA4, the latest version of the platform, view the video in Exhibit 28.12.
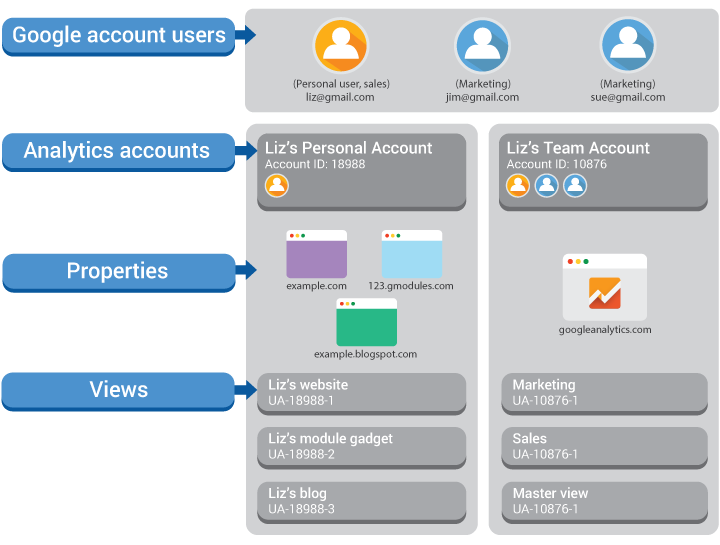
To use Google Analytics, you need a Google Account. Structurally depicted in Exhibit 28.13, the account is a unified sign-in system to authenticate users with email and password, giving them access to products registered with Google. The analytics account is a way to name, organize and track properties (websites, mobile apps, point-of-sale devices) using Google Analytics.
Each Analytics user has access to at least one account.
Once you create your Google Analytics account, you need to set-up the data collection process to track user behaviour on your website. This requires the insertion of tracking codes into webpages, as described in Section Data Collection — Page Tagging (JavaScript).
The tracking code is a snippet of JavaScript code that collects and sends data from your website to the Google Analytics server. For Google Analytics to track users’ behaviour on the site, the code must be added directly to each page on the website or indirectly using a tag management system.
Google Analytics 4 (GA4) uses a measurement model based on events and parameters. For example, a page view is an event called page_view and this event contains the parameters page_location (URL), page_referrer (previous URL) and page_title.
GA4 comprises sets of dashboards classified under the following report books, collectively referred to as the Life Cycle report collection:
- Acquisition reports: track users (total, new and repeat users) and where they come from, i.e., the traffic sources (organic, direct, referral, organic social etc). The metrics include sessions, engagement rate, engagement time, conversions and revenue.
- Engagement reports: track user behaviour in terms of events such as page views, total user engagements, scroll, file downloads etc. Users can view dashboards for each event with details on event count (e.g., number of page views), user count, user demographics (country, age) and events per session. Event-specific information is also included. For instance, the page view dashboards provide the share of page views across pages and the average time users spend on the page.
- Monetization reports: track revenue and purchasers.
- Retention reports: track new and returning users, and retention and engagement by cohort, where cohort comprises new users on charting date. Retention reports include a user engagement dashboard that tracks the decay in the engagement of users over time, i.e., after their first visit.
The above set of report books, called the Life Cycle report collection, are configured to help users understand each stage in the customer journey — from acquisition to retention.
The information content and structure of the above report books is predefined so that the dashboards are easy to read and understand. However, when users are interested in more detailed and in-depth analysis, they should go to the GA4 report library. Here, users can modify existing reports or create new ones, using a wide range of metrics and dimensions to choose from, and they may also use filters to focus on specific details.
Previous Next
Use the Search Bar to find content on MarketingMind.
Contact | Privacy Statement | Disclaimer: Opinions and views expressed on www.ashokcharan.com are the author’s personal views, and do not represent the official views of the National University of Singapore (NUS) or the NUS Business School | © Copyright 2013-2026 www.ashokcharan.com. All Rights Reserved.


