
-
Retail Tracking
Retail Tracking
The Nielsen Code
Applications of Retail Tracking
Where to Measure Sales?
Retail Measurement Services
Retail Universe
Retail Census
Sample Design — Retail Tracking
Data Collection — Retail Tracking
Data Processing — Retail Tracking
Data Projection — Retail Tracking
Analysis and Interpretation — Retail Tracking
Numeric and Weighted Distribution
In-Stock and Out-of-Stock Distribution
Coverage Analysis — Retail Tracking
Pipeline Effect
- Retail Tracking
- Sales and Distribution
- Retail Analytics
- Category Management
- Marketing Education
- Is Marketing Education Fluffy and Weak?
- How to Choose the Right Marketing Simulator
- Self-Learners: Experiential Learning to Adapt to the New Age of Marketing
- Negotiation Skills Training for Retailers, Marketers, Trade Marketers and Category Managers
- Simulators becoming essential Training Platforms
- What they SHOULD TEACH at Business Schools
- Experiential Learning through Marketing Simulators
-
MarketingMind
Retail Tracking
Retail Tracking
The Nielsen Code
Applications of Retail Tracking
Where to Measure Sales?
Retail Measurement Services
Retail Universe
Retail Census
Sample Design — Retail Tracking
Data Collection — Retail Tracking
Data Processing — Retail Tracking
Data Projection — Retail Tracking
Analysis and Interpretation — Retail Tracking
Numeric and Weighted Distribution
In-Stock and Out-of-Stock Distribution
Coverage Analysis — Retail Tracking
Pipeline Effect
- Retail Tracking
- Sales and Distribution
- Retail Analytics
- Category Management
- Marketing Education
- Is Marketing Education Fluffy and Weak?
- How to Choose the Right Marketing Simulator
- Self-Learners: Experiential Learning to Adapt to the New Age of Marketing
- Negotiation Skills Training for Retailers, Marketers, Trade Marketers and Category Managers
- Simulators becoming essential Training Platforms
- What they SHOULD TEACH at Business Schools
- Experiential Learning through Marketing Simulators
Sample Design and Recruitment — Retail Tracking
The sample design is crucial to the accuracy and cost of the service. A well-designed sample ensures that the desired data quality is achieved in an efficient and effective manner.
The key aspects that constitute a sample design are the sampling methodology, the accuracy standard, and the ideal sample size.
Stratified Sampling is the norm for retail tracking. Stratification is a process of dividing a universe into groups (called strata or cell) for the purpose of selecting the sample and projecting each cell separately. Since the retail universe is composed of distinct market breakdowns (MBDs, such as supermarkets, convenience stores, provision stores etc.), it is amenable for stratification. Compared to random sampling, stratified sampling allows for the same level of precision with substantially smaller samples.
The determination of sample size is a commercial decision that weighs the costs with the benefits. Small unreliable samples are not meaningful, and large, overly accurate samples, may not be affordable. An ideal sample is one that precisely meets specifications — it is neither over specified, nor underspecified. The specification of ideal sample size is dependent on the following factors:
- Population variability — the larger the variability the larger the sample size. (Note: This variability is best reflected by the relative standard deviation).
- Sample design — for retail tracking, compared to other methods, stratified sampling allows for substantially smaller sample sizes.
- Specified level of accuracy — the greater the required precision, the larger the sample size. The standards for sampling error are set by the service provider.
A common misconception is that sample size is dependent on population size. In reality it is variability in the population, not its size that determines sample size.
For instance, to measure the size or weight of a number of identical marbles, the sample size need only be one, irrespective of whether universe constitutes of a few marbles or a very large number of marbles. Countries like China and India, with a large population of stores, require big samples because store variability is large, and product distribution is low.
In practice data accuracy is a touchy subject since the retail index is a reflection of performance. Often business managers express their disbelief that a sample of say 50 is adequate to calibrate a universe of 2,000 stores.
One example that illustrates the use of sampling is the blood test. Just as a doctor only draws a small sample for a blood test, so too a research firm requires a relatively small sample to calibrate its universe in conformance with accuracy standards.
The accuracy standards reflect the acceptable tolerance level of error, at a specified level of confidence. NielsenIQ’s global standard for sampling error (aka relative standard error), set at 90% level of confidence and applicable to categories that are available in 80% of the universe, is as follows:
- National Market: ±3% of sales level
- Major Market Breakdowns/Channels: ±6% of sales level
- Minor Market Breakdowns: ±6 to 10% of sales level
According to this standard, the sample should be configured such that for a national market the probability that estimated sales value will lie within ±3% of actual value is 90%.
Once the sample is designed, the process of recruitment commences. To eliminate bias and eradicate systematic errors, the sample is recruited via a controlled, randomised selection process.
Further details of accuracy standards, sampling methods, and the statistics of sampling are provided in Chapter 34, Sampling. As for the statistical equations for computing sample size, refer the Section Sample Size — Stratified Sampling, in the same chapter.
Previous Next
Use the Search Bar to find content on MarketingMind.
Business Intelligence - Market and Trade
Suite of interactive, online dashboards that seamlessly integrate retail and consumer data sources in a manner that makes it easier to glean insights.
Scan Track
Suite of dashboards to visualize/analyse retail scan data.
Online Apps to train Category Managers
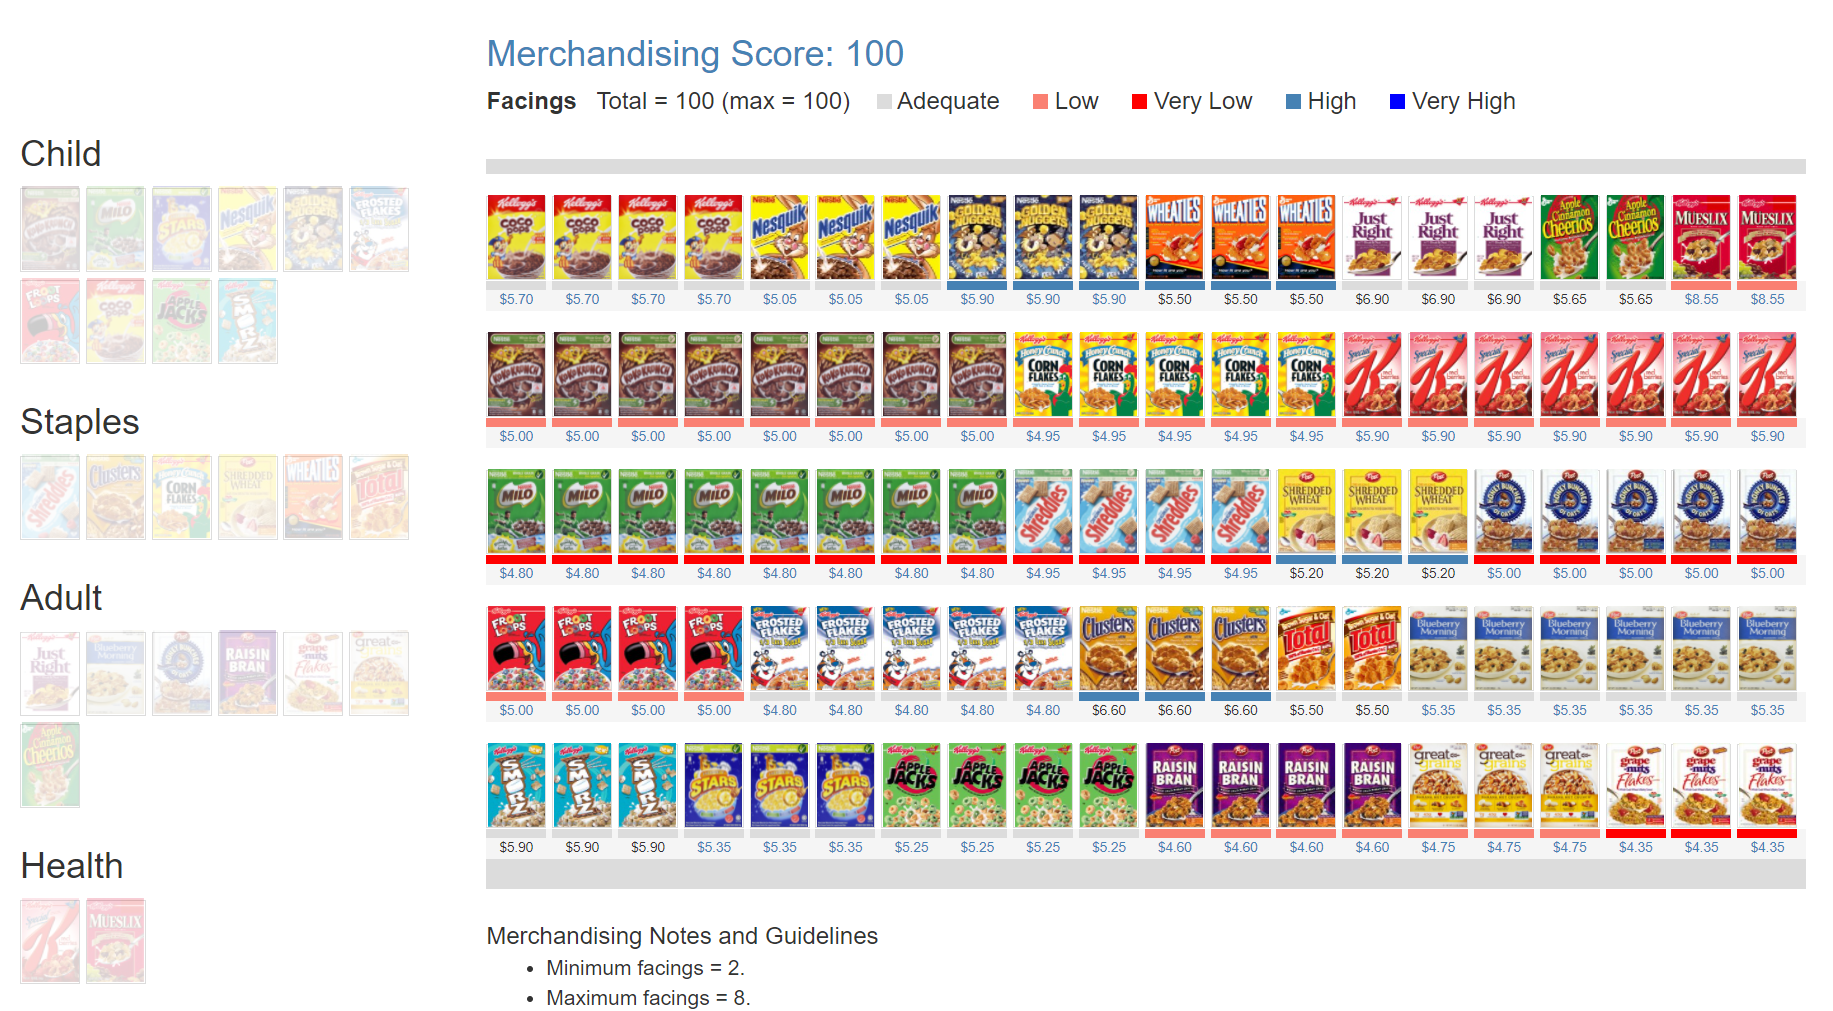
The Plannogrammer is an experiential learning facility for category managers, trade marketers, and retailers in consumer markets. Ideally suited for hybrid learning programmes, Plannogrammer imparts hands-on training in the planning and evaluation of promotions and merchandising.
It supports a collection of simulation and analysis platforms such as Promotions and Space Planner for optimizing space and promotions, Plannogram for populating shelves and merchandising, a Due To Analysis dashboard that decomposes brand sales into the factors driving sales, and a Promotion Evaluator to evaluate the volume, value and profit impact of promotion plans.


Contact | Privacy Statement | Disclaimer: Opinions and views expressed on www.ashokcharan.com are the author’s personal views, and do not represent the official views of the National University of Singapore (NUS) or the NUS Business School | © Copyright 2013-2026 www.ashokcharan.com. All Rights Reserved.