
-
Retail Tracking
Retail Tracking
The Nielsen Code
Applications of Retail Tracking
Where to Measure Sales?
Retail Measurement Services
Retail Universe
Retail Census
Sample Design — Retail Tracking
Data Collection — Retail Tracking
Data Processing — Retail Tracking
Data Projection — Retail Tracking
Analysis and Interpretation — Retail Tracking
Numeric and Weighted Distribution
In-Stock and Out-of-Stock Distribution
Coverage Analysis — Retail Tracking
Pipeline Effect
- Retail Tracking
- Sales and Distribution
- Retail Analytics
- Category Management
- Marketing Education
- Is Marketing Education Fluffy and Weak?
- How to Choose the Right Marketing Simulator
- Self-Learners: Experiential Learning to Adapt to the New Age of Marketing
- Negotiation Skills Training for Retailers, Marketers, Trade Marketers and Category Managers
- Simulators becoming essential Training Platforms
- What they SHOULD TEACH at Business Schools
- Experiential Learning through Marketing Simulators
-
MarketingMind
Retail Tracking
Retail Tracking
The Nielsen Code
Applications of Retail Tracking
Where to Measure Sales?
Retail Measurement Services
Retail Universe
Retail Census
Sample Design — Retail Tracking
Data Collection — Retail Tracking
Data Processing — Retail Tracking
Data Projection — Retail Tracking
Analysis and Interpretation — Retail Tracking
Numeric and Weighted Distribution
In-Stock and Out-of-Stock Distribution
Coverage Analysis — Retail Tracking
Pipeline Effect
- Retail Tracking
- Sales and Distribution
- Retail Analytics
- Category Management
- Marketing Education
- Is Marketing Education Fluffy and Weak?
- How to Choose the Right Marketing Simulator
- Self-Learners: Experiential Learning to Adapt to the New Age of Marketing
- Negotiation Skills Training for Retailers, Marketers, Trade Marketers and Category Managers
- Simulators becoming essential Training Platforms
- What they SHOULD TEACH at Business Schools
- Experiential Learning through Marketing Simulators
Applications of Retail Tracking
The retail tracking service yields metrics like market share (a term coined in 1935 by Arthur Nielsen), sales and measures for distribution. These measures, which are fundamental to formulating marketing strategies and sales plans, have numerous applications, including the following:
- Develop market strategies.
- Monitor brand health in terms of sales and distribution.
- Monitor competition.
- Understand market opportunities and threats.
- Develop sales plans.
- Evaluate performance in trade.
- Diagnose issues in distribution.
- Set goals and targets.
- Evaluate performance of individuals — business leaders, marketing and sales personnel.
The Data
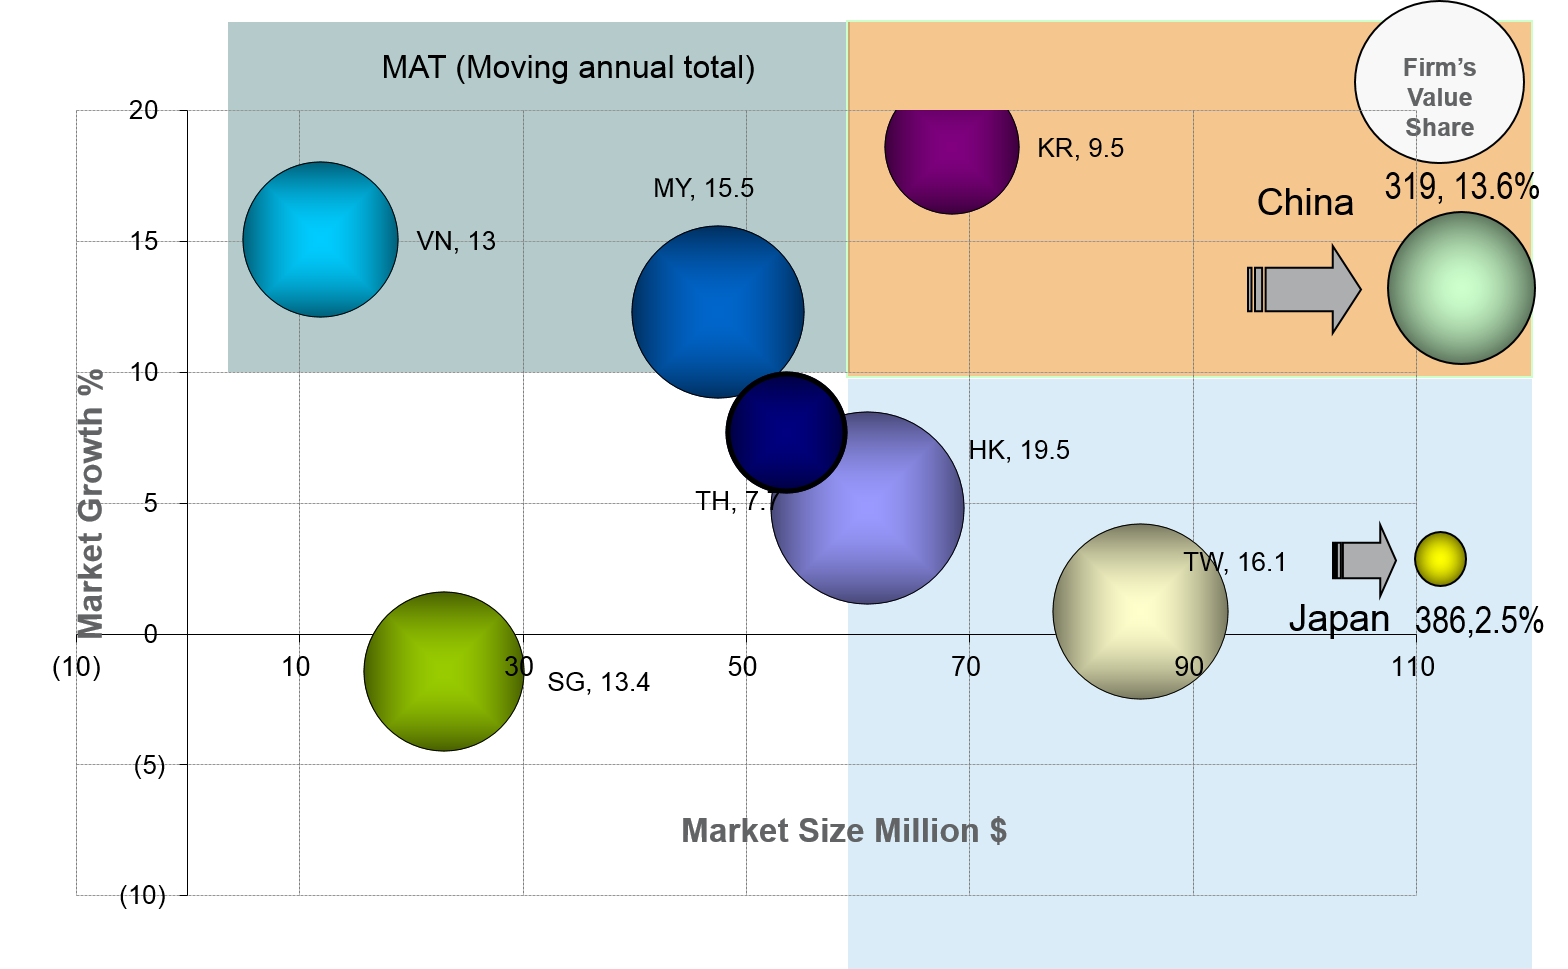
Exhibit 30.2 Attractiveness of product category across some Asian markets.
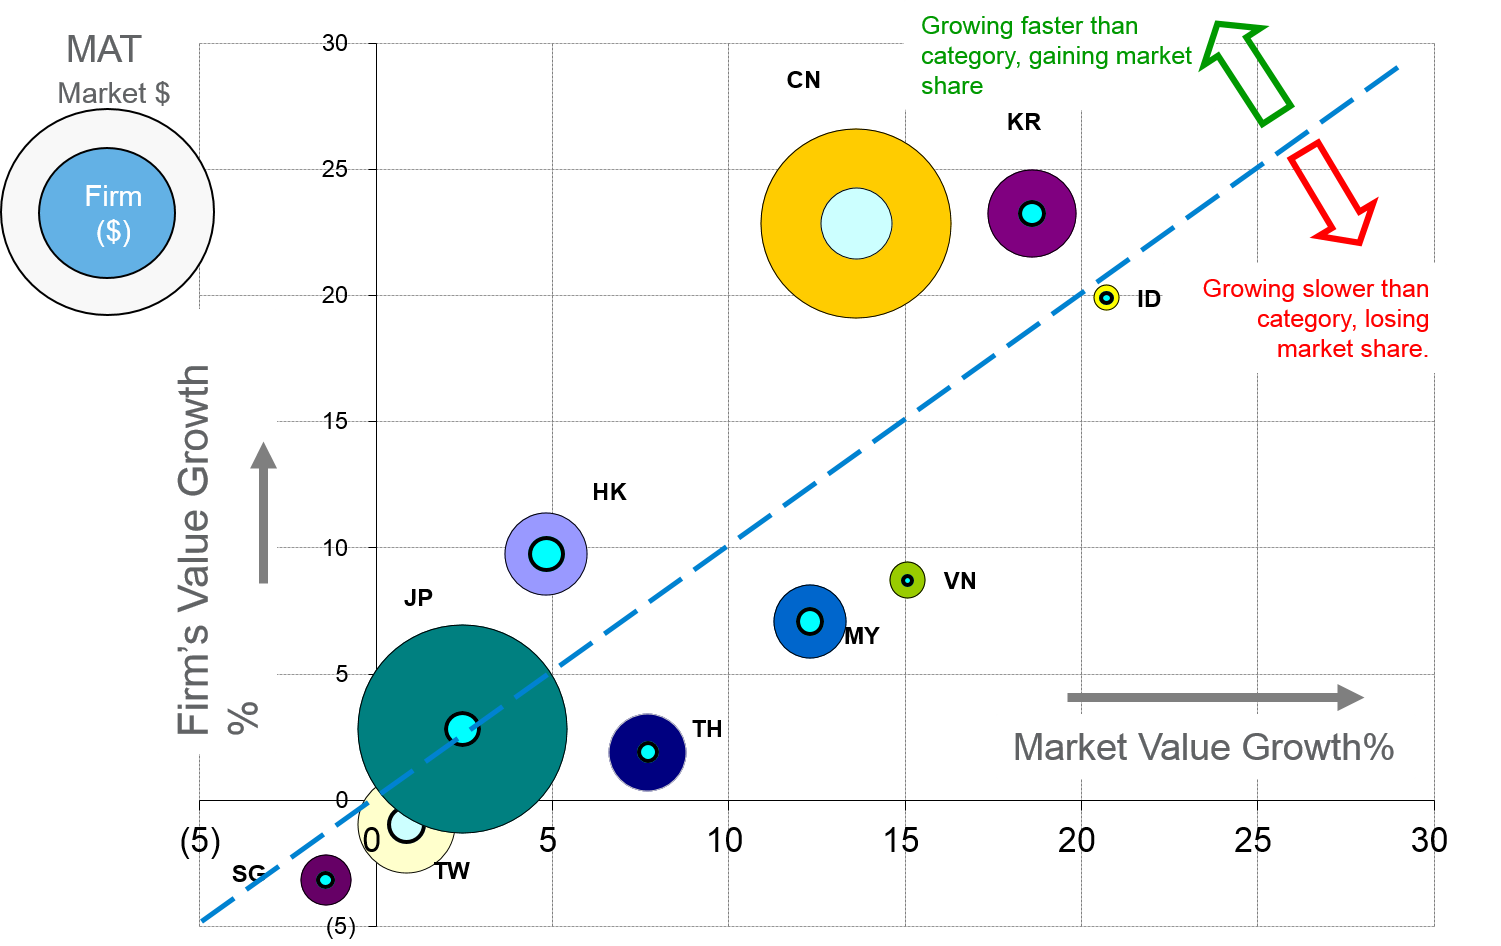
Exhibit 30.3 Firm’s growth across the Asian markets.
Exhibits 30.2 and 30.3 provide a helicopter view of retail tracking data. The charts depict a visual overview of the sales of a product category and the sales of a firm’s products in that category, across a number of Asian markets. They are configured to reveal the overall category and corporate performance, across the different markets in the region.
Whereas Japan (JP), in this example, is the biggest market in the region in terms of category sales, China (CN) is the most important market for this company. The inner circles in Exhibit 30.3, which represents the firm’s sales, reveal that it is the firm’s largest market; one where it is experiencing a 22.5% growth in value terms on a moving annual total (MAT) basis, which is well above the average category growth of 13.5%. Note too that this firm is also gaining share in South Korea (KR) and Hong Kong (HK) and losing share in Thailand (TH), Vietnam (VN), Malaysia (MY) and Singapore (SG). This macro view serves as a regional overview, highlighting the firm’s performance across countries.
To act on the information, marketers need to drill down to markets, segments, and brands, identify opportunities and threats, and take strategic and tactical decisions. Brand and sales managers are therefore typically interested in the data at a brand and item level — variants, pack sizes — across segments, across chains, channels and markets, and across time periods — weeks, months, years. They need to know sales, market share and growth rates. They need to know distribution in terms of numeric, weighted, in-stock and out-of-stock. And they need this information for their own brands as well as their competitors’ brands.
Considering that a FMCG category typically comprises a few thousand stock keeping units (SKUs — i.e., items stocked), the data turns out to be extensive. To facilitate easy access to so much content, the data is hosted on user friendly software that permits speedy access to relevant data and supports visualization tools that make it easier for minds to process the information.
Performance Evaluation
Retail index is also increasingly used by firms for setting targets and for evaluating the performance of business units, business leaders, and marketing and sales associates. For example, during his tenure as CEO, Bart Becht benchmarked Reckitt Benckiser’s (RB) performance on Nielsen’s estimate for category growth rate. RB’s growth targets were set at +2% points ahead of Nielsen’s growth estimate.
The research agency’s estimates are viewed as accurate, objective, third party measures of the firm’s performance, and key metrics like market share and growth are considered essential Key Performance Indicators (KPIs) for the firm.
One drawback associated with using this data for performance evaluation is the potential politicization of the retail index. Besides heightening pressures and expectations on data integrity, it can, sometimes, divert attention from the core objectives of the research.
Retail Index, Consumer Panels and Customized Research
The retail index yields a host of very useful metrics for formulating market strategies and sales plans. Basic measures like market share, sales and distribution serve also as key brand health indicators. For deeper diagnosis of brand health, however, it is advisable to use the retail index in conjunction with quantitative and qualitative customized research as well as consumer analytics data from sources such as consumer panels and loyalty panels.
Consumer analytics reveal behavioural information that provides for an improved understanding of the factors affecting a brand’s health.
To diagnose issues, marketers also need to peek into consumers’ minds — Why are they buying what they are buying? This can be crucially important when it comes to acting on the information, and it falls within the scope of customized consumer research, both qualitative and quantitative.
All the three forms of research — retail tracking, customized research and consumer analytics have their strengths and limitation. They do, however, combine well to provide marketers with a holistic and powerfully diagnostic understanding of business issues in general.
However, do note that it is neither necessary, nor, in the case of small brands, desirable to purchase all forms of research, on an ongoing basis. Marketers should procure research based on their needs, weighing the costs and the benefits of doing so.
Previous Next
Use the Search Bar to find content on MarketingMind.
Business Intelligence - Market and Trade
Suite of interactive, online dashboards that seamlessly integrate retail and consumer data sources in a manner that makes it easier to glean insights.
Scan Track
Suite of dashboards to visualize/analyse retail scan data.
Online Apps to train Retailers
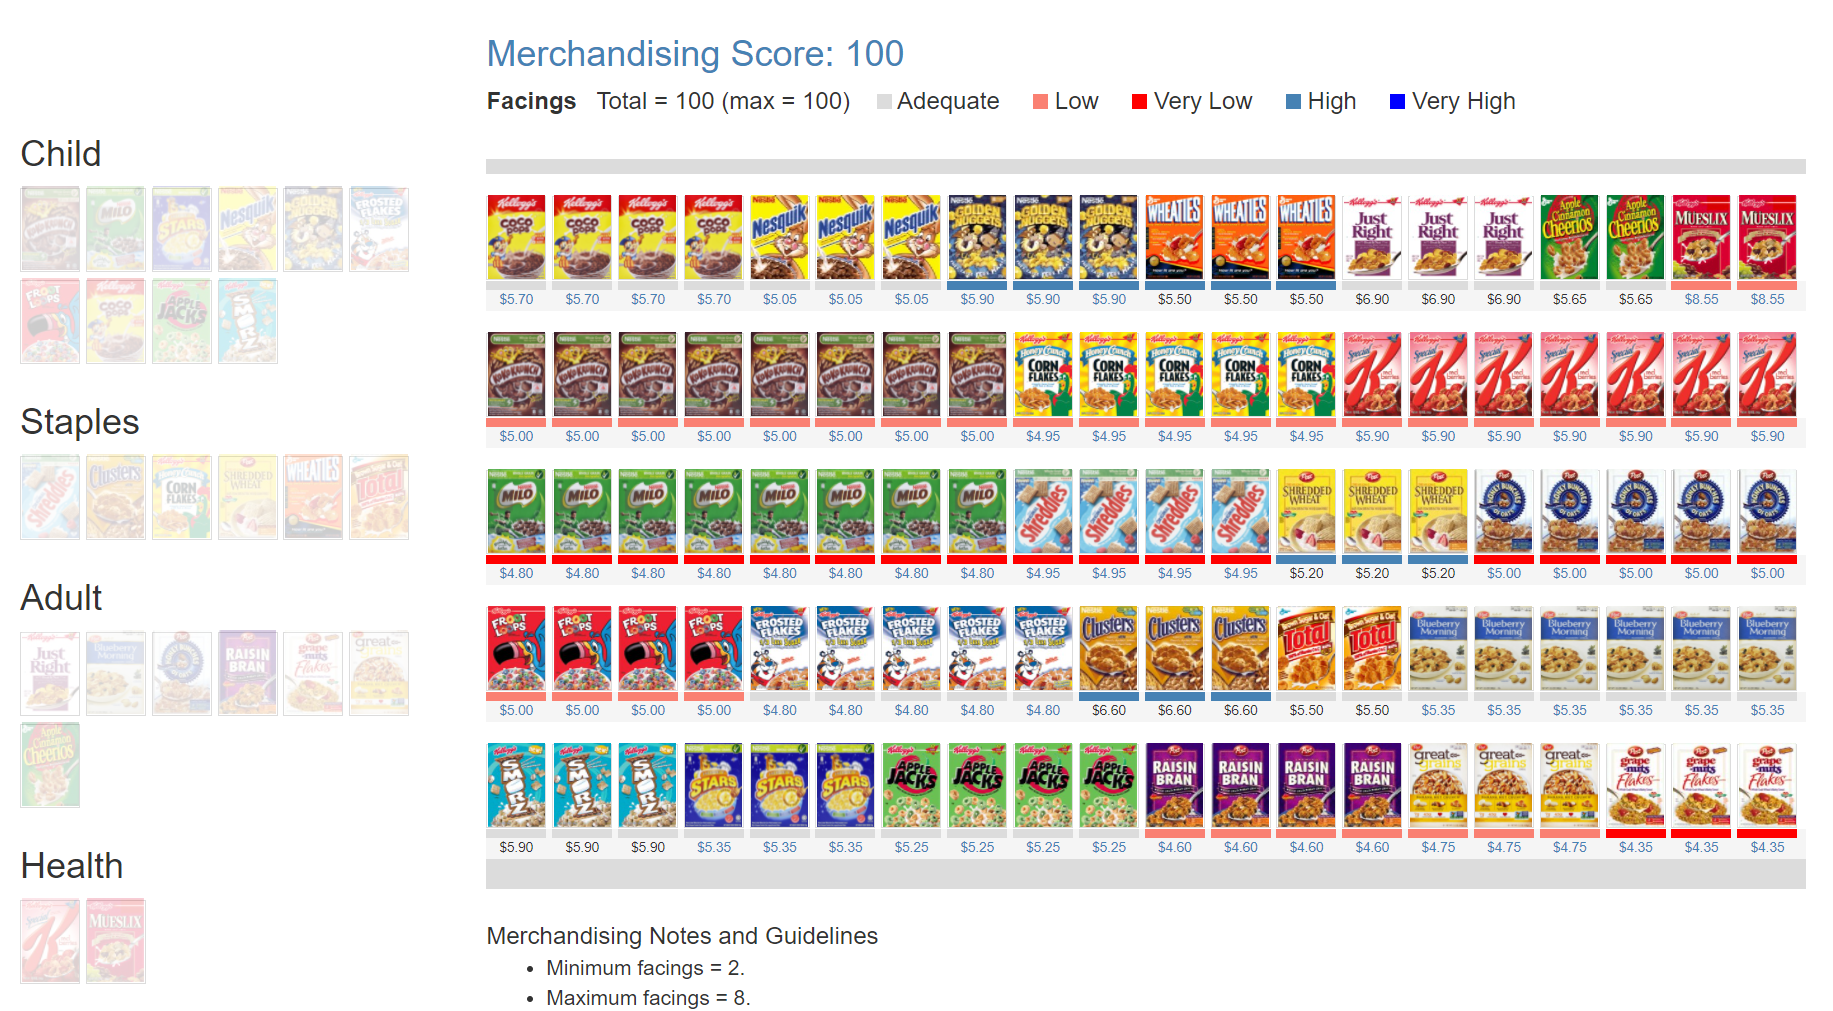
The Plannogrammer is an experiential learning facility for category managers, trade marketers, and retailers in consumer markets. Ideally suited for hybrid learning programmes, Plannogrammer imparts hands-on training in the planning and evaluation of promotions and merchandising.
It supports a collection of simulation and analysis platforms such as Promotions and Space Planner for optimizing space and promotions, Plannogram for populating shelves and merchandising, a Due To Analysis dashboard that decomposes brand sales into the factors driving sales, and a Promotion Evaluator to evaluate the volume, value and profit impact of promotion plans.


Contact | Privacy Statement | Disclaimer: Opinions and views expressed on www.ashokcharan.com are the author’s personal views, and do not represent the official views of the National University of Singapore (NUS) or the NUS Business School | © Copyright 2013-2026 www.ashokcharan.com. All Rights Reserved.