-
Retail Tracking
Retail Tracking
The Nielsen Code
Applications of Retail Tracking
Where to Measure Sales?
Retail Measurement Services
Retail Universe
Retail Census
Sample Design — Retail Tracking
Data Collection — Retail Tracking
Data Processing — Retail Tracking
Data Projection — Retail Tracking
Analysis and Interpretation — Retail Tracking
Numeric and Weighted Distribution
In-Stock and Out-of-Stock Distribution
Coverage Analysis — Retail Tracking
Pipeline Effect
- Retail Tracking
- Sales and Distribution
- Retail Analytics
- Category Management
- Marketing Education
- Is Marketing Education Fluffy and Weak?
- How to Choose the Right Marketing Simulator
- Self-Learners: Experiential Learning to Adapt to the New Age of Marketing
- Negotiation Skills Training for Retailers, Marketers, Trade Marketers and Category Managers
- Simulators becoming essential Training Platforms
- What they SHOULD TEACH at Business Schools
- Experiential Learning through Marketing Simulators
-
MarketingMind
Retail Tracking
Retail Tracking
The Nielsen Code
Applications of Retail Tracking
Where to Measure Sales?
Retail Measurement Services
Retail Universe
Retail Census
Sample Design — Retail Tracking
Data Collection — Retail Tracking
Data Processing — Retail Tracking
Data Projection — Retail Tracking
Analysis and Interpretation — Retail Tracking
Numeric and Weighted Distribution
In-Stock and Out-of-Stock Distribution
Coverage Analysis — Retail Tracking
Pipeline Effect
- Retail Tracking
- Sales and Distribution
- Retail Analytics
- Category Management
- Marketing Education
- Is Marketing Education Fluffy and Weak?
- How to Choose the Right Marketing Simulator
- Self-Learners: Experiential Learning to Adapt to the New Age of Marketing
- Negotiation Skills Training for Retailers, Marketers, Trade Marketers and Category Managers
- Simulators becoming essential Training Platforms
- What they SHOULD TEACH at Business Schools
- Experiential Learning through Marketing Simulators
Retail Universe
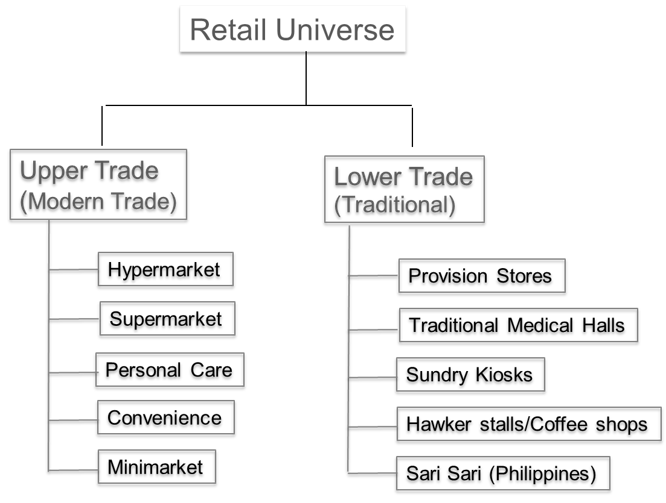
Exhibit 30.5 FMCG Retail Universe (an example).
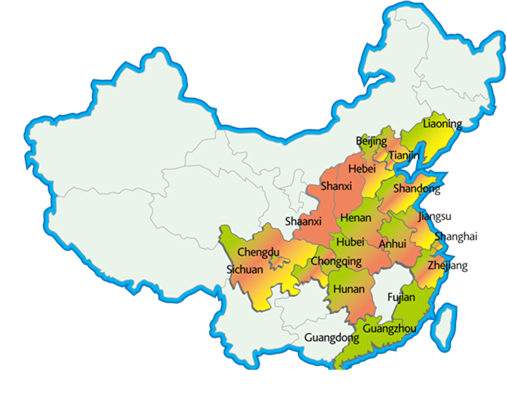
Exhibit 30.6 Nielsen’s retail universe (2008) excludes rural areas and the sparsely populated Western region of China.
Among the various classes of goods, Fast Moving Consumer Goods (FMCG) stands out as the most complex in terms of distribution. At the broadest level, as shown in Exhibit 30.5, FMCG distribution can be categorized as the upper trade and the lower trade.
The upper trade, which refers to the organized sector or modern trade, comprises store formats such as supermarkets like Walmart, Tesco and Carrefour; convenience stores like 7-Eleven, Circle K and Lawson; and personal care and health outlets like Boots, Walgreens and Watsons.
On the other hand, the lower trade consists of a diverse array of traditional, independent stores, including provision stores and sundry kiosks.
Notably, despite representing a mere 1.6% of the total number of stores in Asia based on Nielsen’s estimates, the upper trade accounts for a significant 53% of total FMCG sales in terms of value. In the more developed markets of Europe, North America and the Pacific, the contribution of the upper trade to overall FMCG sales is substantially larger.
Tracking FMCG products presents various challenges. Accessing certain locations, including schools, offices, tourist destinations, hotels, bars, construction sites, army camps, and transient hawkers, can be difficult for the service provider. Moreover, there may be instances where chain stores decline to participate in the tracking service. In large countries like China (as shown in Exhibit 30.6), the cost of covering the entire geographic area can be prohibitively high, resulting in the exclusion of less densely populated provinces and villages from the service coverage.
The retail universe is therefore a subset of the real world and should be clearly defined by the service provider. This definition typically provides an outline of the channels and geographical areas that are covered as well as those that are excluded.
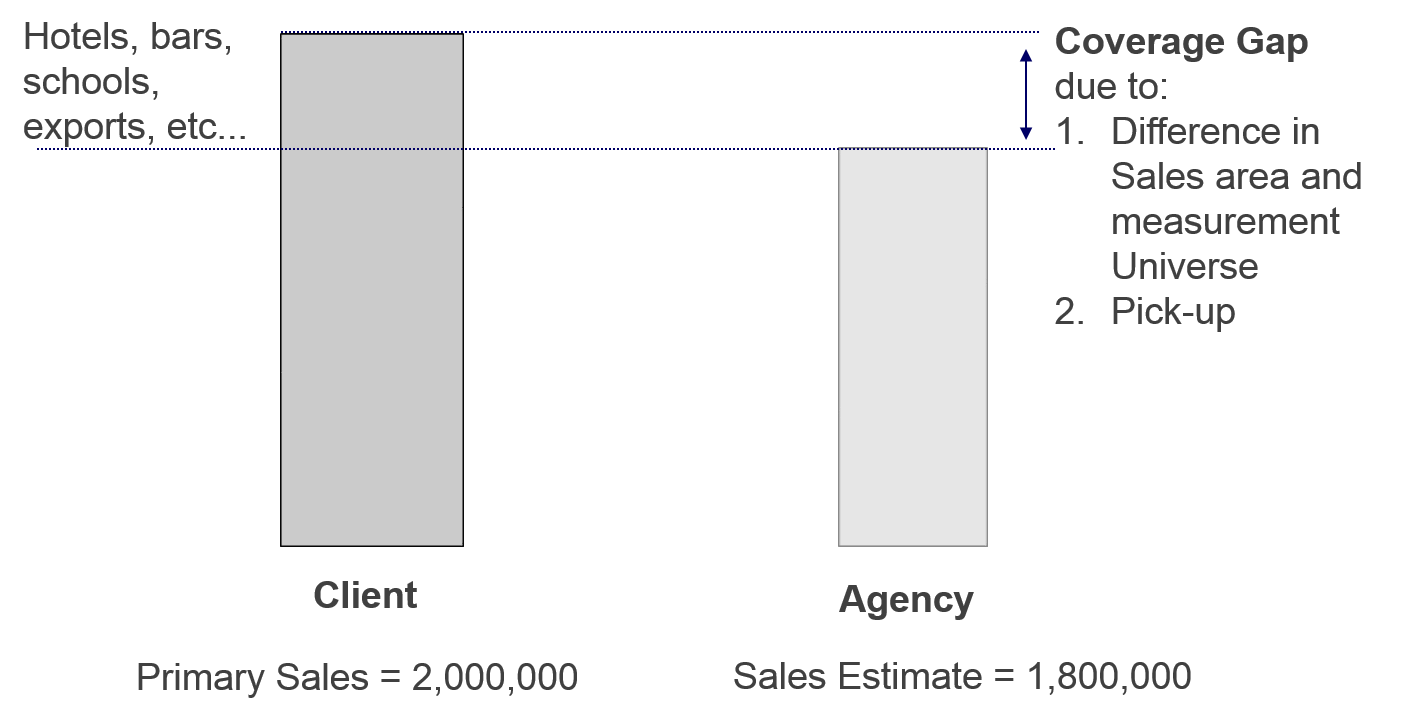
The shortfall in the retail index sales estimate for a product is the called the coverage gap (refer to Exhibit 30.7). It is usually represented as a ratio — i.e., the measured purchase volume as a proportion of the firm’s total shipments within the market.
The shortfall is due to two factors:
- The difference in the product’s sales area and the agency’s universe, and
- The difference between agency’s sales estimate and the brand’s shipments to the agency’s universe. The ratio, agency’s sales estimate/ shipments to universe, is referred to as pick-up.
Analysis of coverage is covered in detail with some case examples, in Section Coverage Analysis.
Previous Next
Use the Search Bar to find content on MarketingMind.
Business Intelligence - Market and Trade
Suite of interactive, online dashboards that seamlessly integrate retail and consumer data sources in a manner that makes it easier to glean insights.
Scan Track
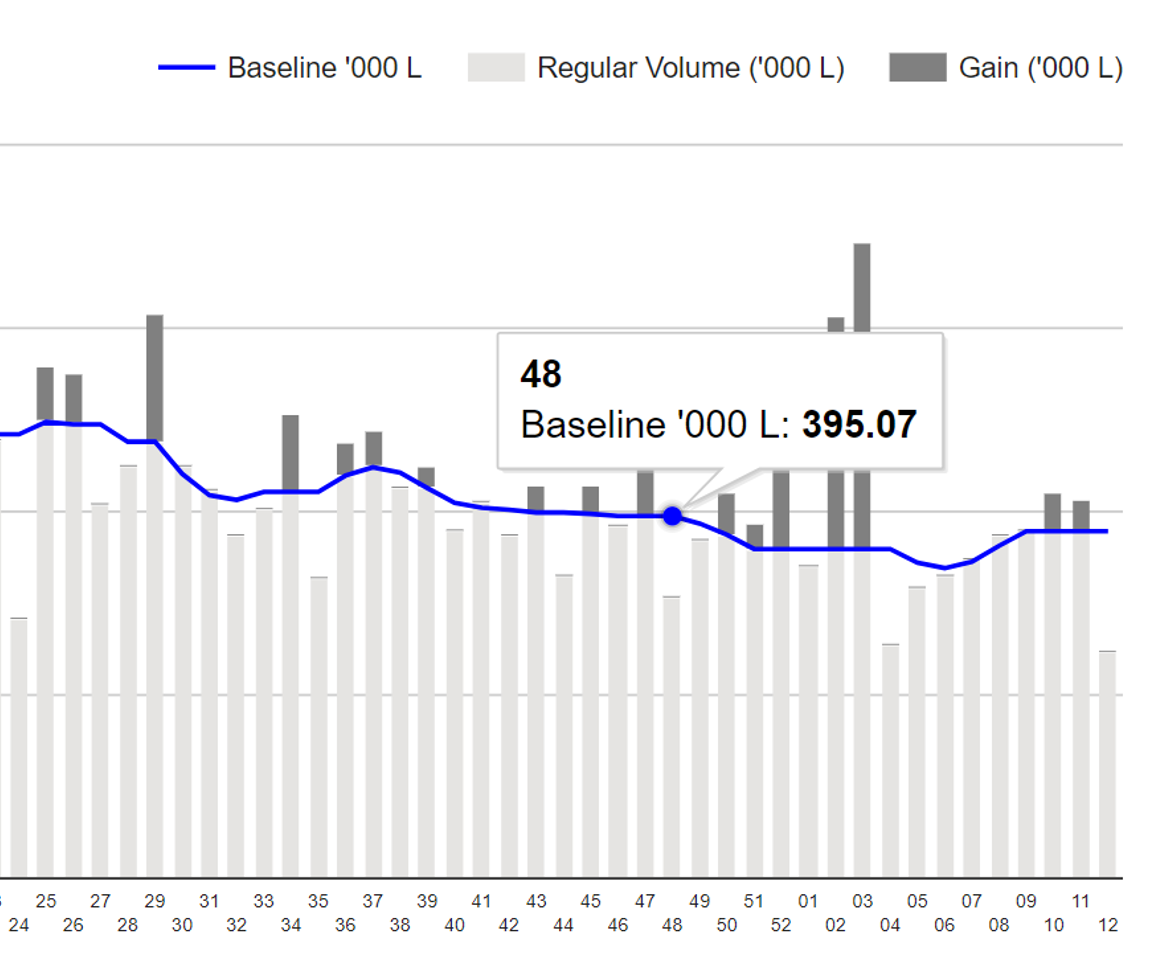
Suite of dashboards to visualize/analyse retail scan data.
Online Apps to train Category Managers
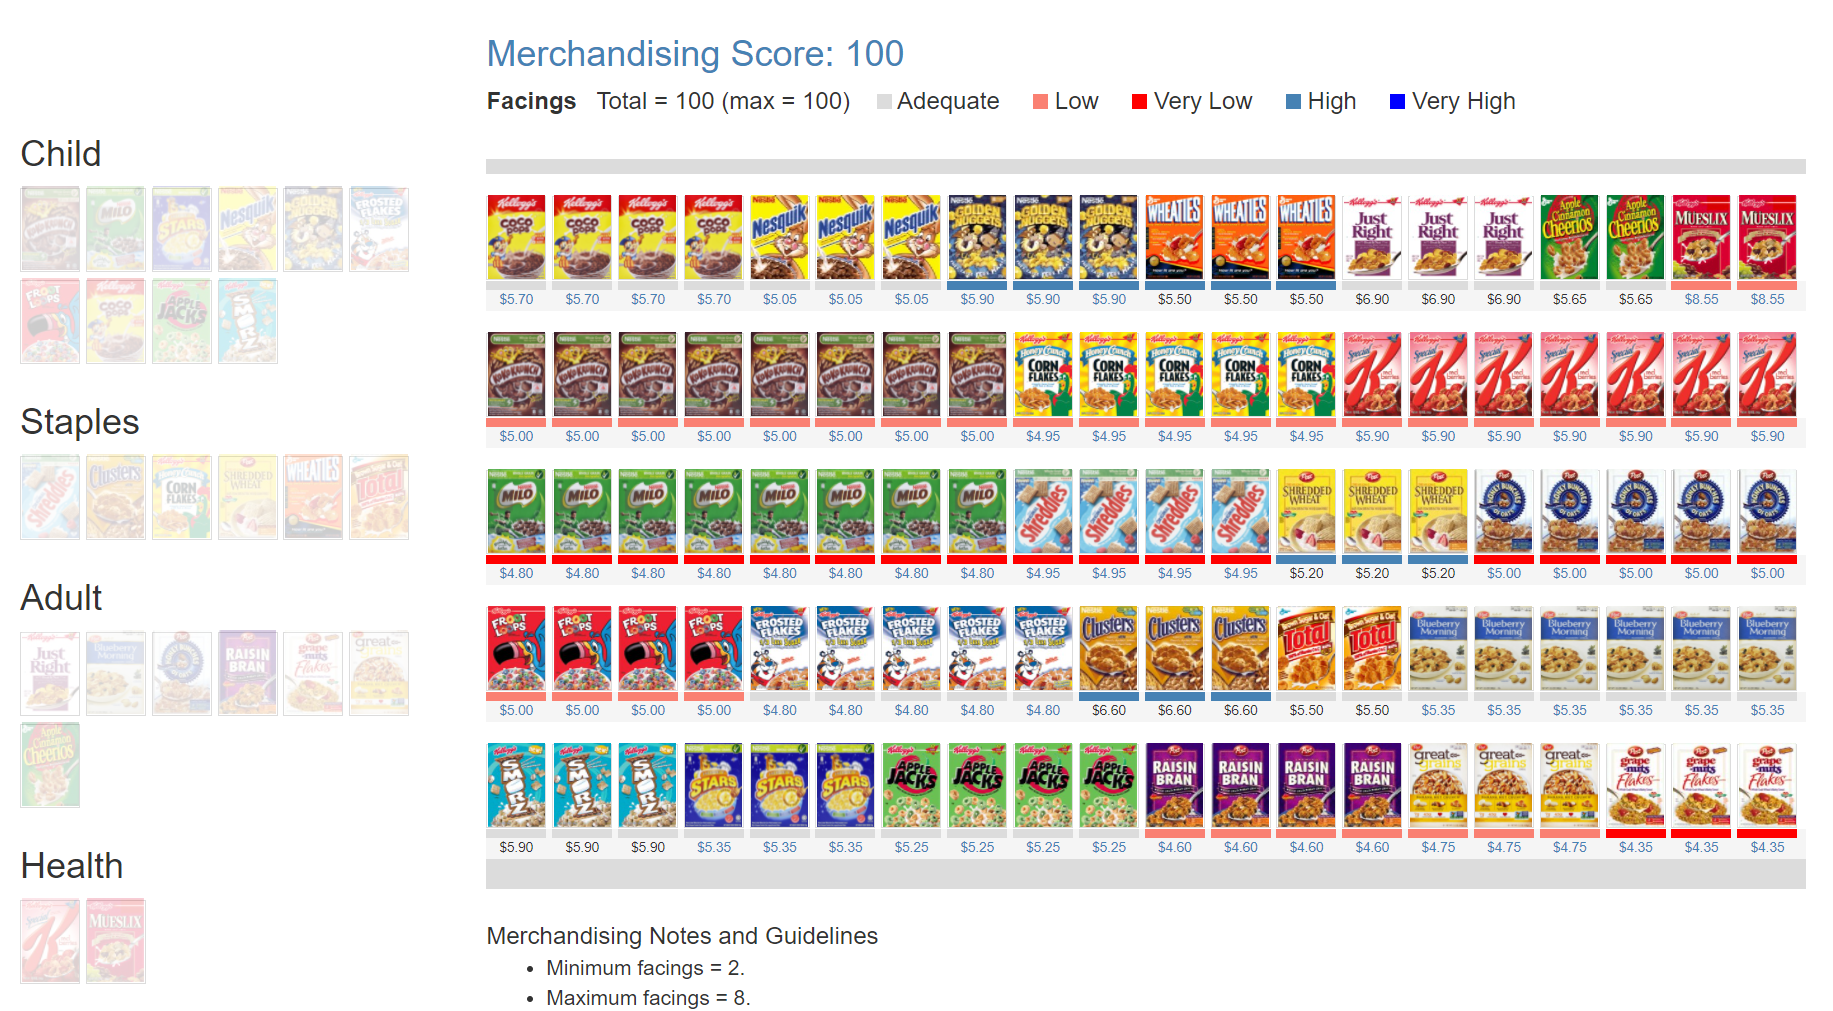
The Plannogrammer is an experiential learning facility for category managers, trade marketers, and retailers in consumer markets. Ideally suited for hybrid learning programmes, Plannogrammer imparts hands-on training in the planning and evaluation of promotions and merchandising.
It supports a collection of simulation and analysis platforms such as Promotions and Space Planner for optimizing space and promotions, Plannogram for populating shelves and merchandising, a Due To Analysis dashboard that decomposes brand sales into the factors driving sales, and a Promotion Evaluator to evaluate the volume, value and profit impact of promotion plans.
Contact | Privacy Statement | Disclaimer: Opinions and views expressed on www.ashokcharan.com are the author’s personal views, and do not represent the official views of the National University of Singapore (NUS) or the NUS Business School | © Copyright 2013-2026 www.ashokcharan.com. All Rights Reserved.

