
-
Retail Tracking
Retail Tracking
The Nielsen Code
Applications of Retail Tracking
Where to Measure Sales?
Retail Measurement Services
Retail Universe
Retail Census
Sample Design — Retail Tracking
Data Collection — Retail Tracking
Data Processing — Retail Tracking
Data Projection — Retail Tracking
Analysis and Interpretation — Retail Tracking
Numeric and Weighted Distribution
In-Stock and Out-of-Stock Distribution
Coverage Analysis — Retail Tracking
Pipeline Effect
- Retail Tracking
- Sales and Distribution
- Retail Analytics
- Category Management
- Marketing Education
- Is Marketing Education Fluffy and Weak?
- How to Choose the Right Marketing Simulator
- Self-Learners: Experiential Learning to Adapt to the New Age of Marketing
- Negotiation Skills Training for Retailers, Marketers, Trade Marketers and Category Managers
- Simulators becoming essential Training Platforms
- What they SHOULD TEACH at Business Schools
- Experiential Learning through Marketing Simulators
-
MarketingMind
Retail Tracking
Retail Tracking
The Nielsen Code
Applications of Retail Tracking
Where to Measure Sales?
Retail Measurement Services
Retail Universe
Retail Census
Sample Design — Retail Tracking
Data Collection — Retail Tracking
Data Processing — Retail Tracking
Data Projection — Retail Tracking
Analysis and Interpretation — Retail Tracking
Numeric and Weighted Distribution
In-Stock and Out-of-Stock Distribution
Coverage Analysis — Retail Tracking
Pipeline Effect
- Retail Tracking
- Sales and Distribution
- Retail Analytics
- Category Management
- Marketing Education
- Is Marketing Education Fluffy and Weak?
- How to Choose the Right Marketing Simulator
- Self-Learners: Experiential Learning to Adapt to the New Age of Marketing
- Negotiation Skills Training for Retailers, Marketers, Trade Marketers and Category Managers
- Simulators becoming essential Training Platforms
- What they SHOULD TEACH at Business Schools
- Experiential Learning through Marketing Simulators
Data Projection — Retail Tracking
Ratio Estimation
The commonly used methodology for projecting data is called ratio estimation or ratio projection. Before delving into ratio estimation, let us first discuss a simpler approach called numeric projection. In numeric projection, if there are 1,000 outlets in the market universe and the sample size is 100 (representing 10% of the universe), the numeric projection factor would be 10 times. While straightforward, this approach fails to account for any potential bias within the sample.
Ratio projection, on the other hand, takes the all-commodity value (ACV) as the basis for the projection factor. ACV represents the sales value of all product categories tracked by the research firm and is obtained from census data. The ACV sales in the sample stores reflect the relative size of these stores.
For example, if the estimated ACV of the 100 sample stores is 12.5% of the ACV of the 1,000 stores in the universe (indicating that the sample stores are relatively larger on average), the ratio projection factor would be 8. By incorporating the size of the stores into the projection factor, ratio estimation provides greater accuracy in the projection.
Ratio estimation also addresses the issue of erroneous fluctuations in sales estimates that can arise from store churn within the sample. Over time, the composition of stores in the sample is likely to vary due to attrition. If a smaller store in the sample is replaced by a larger store, the numeric projection method would tend to inflate the sales estimate since the numeric projection factor remains constant and fails to consider store size. However, with ratio estimation, the store ACV is taken into account, enabling it to effectively accommodate changes within the sample and minimize the impact on estimation accuracy.
Lapsed Audit Days — Adjustment Factor
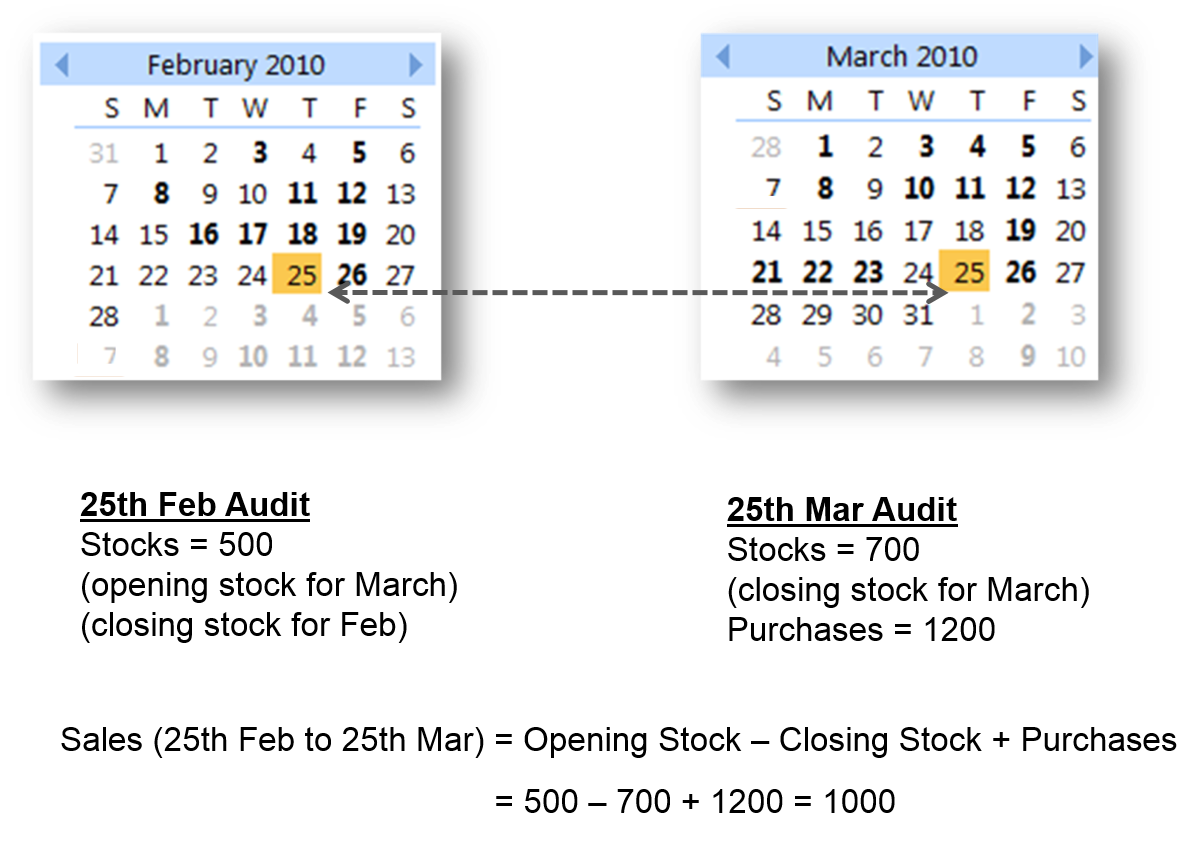
In the case of manual audits, there is often variation in the time interval between audits from month to month. For example, the retailer purchases data collected on March 25th for the store mentioned in Exhibit 30.11 corresponds to the 28-day interval between February 25th and March 25th. To ensure consistency, this time interval, known as lapsed days, is adjusted to reflect a standardized 30.5-day interval. This adjustment ensures that each of the 12 monthly periods in a year are of equal size.
In the given example, the 1,000 units of sales estimated in Exhibit 30.11 would be adjusted to 1,089 units. This adjustment is calculated by multiplying the estimated sales figure by the ratio of the standardized 30.5-day interval to the original 28-day interval (i.e., 1,000 × 30.5/28).
Audit — Reporting Period
In the example provided, you may have noticed that the data does not solely pertain to either February or March; instead, it covers the period from February 25th to March 25th. However, in the retail index report, this data is categorized under March.
This peculiarity is inherent in manual audits, where the actual reporting period can vary from one store to another depending on their specific audit cycle. As stores are audited throughout the month of March, the estimates for March will reflect a combination of sales from both February and March.
For stores that were audited at the beginning of March, the data for March will include a larger portion of sales from February. On the other hand, for stores audited towards the end of March, the data will be predominantly representative of sales that occurred during March.
When interpreting manual audit data, it is crucial to keep in mind that the retail audit report for any given month represents a blend of sales from both that particular month and the preceding month.
Data Imputation Techniques, Matrix Projection
Data imputation techniques ensure the accuracy and completeness of data in retail tracking services. In the context of scan channels, where estimates are primarily derived from collaborating chains, it is necessary to employ strategies for estimating data for non-collaborating chains. This is typically achieved by leveraging data from similar stores within the sample.
However, it is important to note that if the stores of non-collaborating chains significantly differ from those in the retail panel, it is advisable to exclude such chains from the universe definition. This ensures that the data remains representative and reliable for analysis.
Given the reliance on external factors beyond the agency’s control, there are instances where issues or challenges arise that need to be addressed. To proactively manage such situations, agencies maintain a range of standardized techniques aimed at maintaining data quality.
For example, there may be cases where data obtained from a collaborating retailer contains missing or unusable data for certain stores. In such situations, the missing store data is imputed using prior period data for the same stores and adjusted to reflect the trend (increase or decrease) observed in other similar stores, for each specific item.
Consider for instance the following sales data for a brand in stores X and Y:
Jan Feb
Store X 1200 missing data
Store Y 1000 1050
If store Y is similar to store X, one may estimate Feb sales of the brand in store X, by projecting the increase in sales in store Y (1050/1000 = 1.05) to that of the sales of the brand in Jan, in store X:
$$Estimated \,Feb \,Sales \,in \,Store \,X \,= \,1200\,×\,1.05\,=\,1260$$This imputation technique which is commonly used for estimating missing sales data is called matrix projection.
Previous Next
Use the Search Bar to find content on MarketingMind.
Business Intelligence - Market and Trade
Suite of interactive, online dashboards that seamlessly integrate retail and consumer data sources in a manner that makes it easier to glean insights.
Scan Track
Suite of dashboards to visualize/analyse retail scan data.
Online Apps to train Category Managers
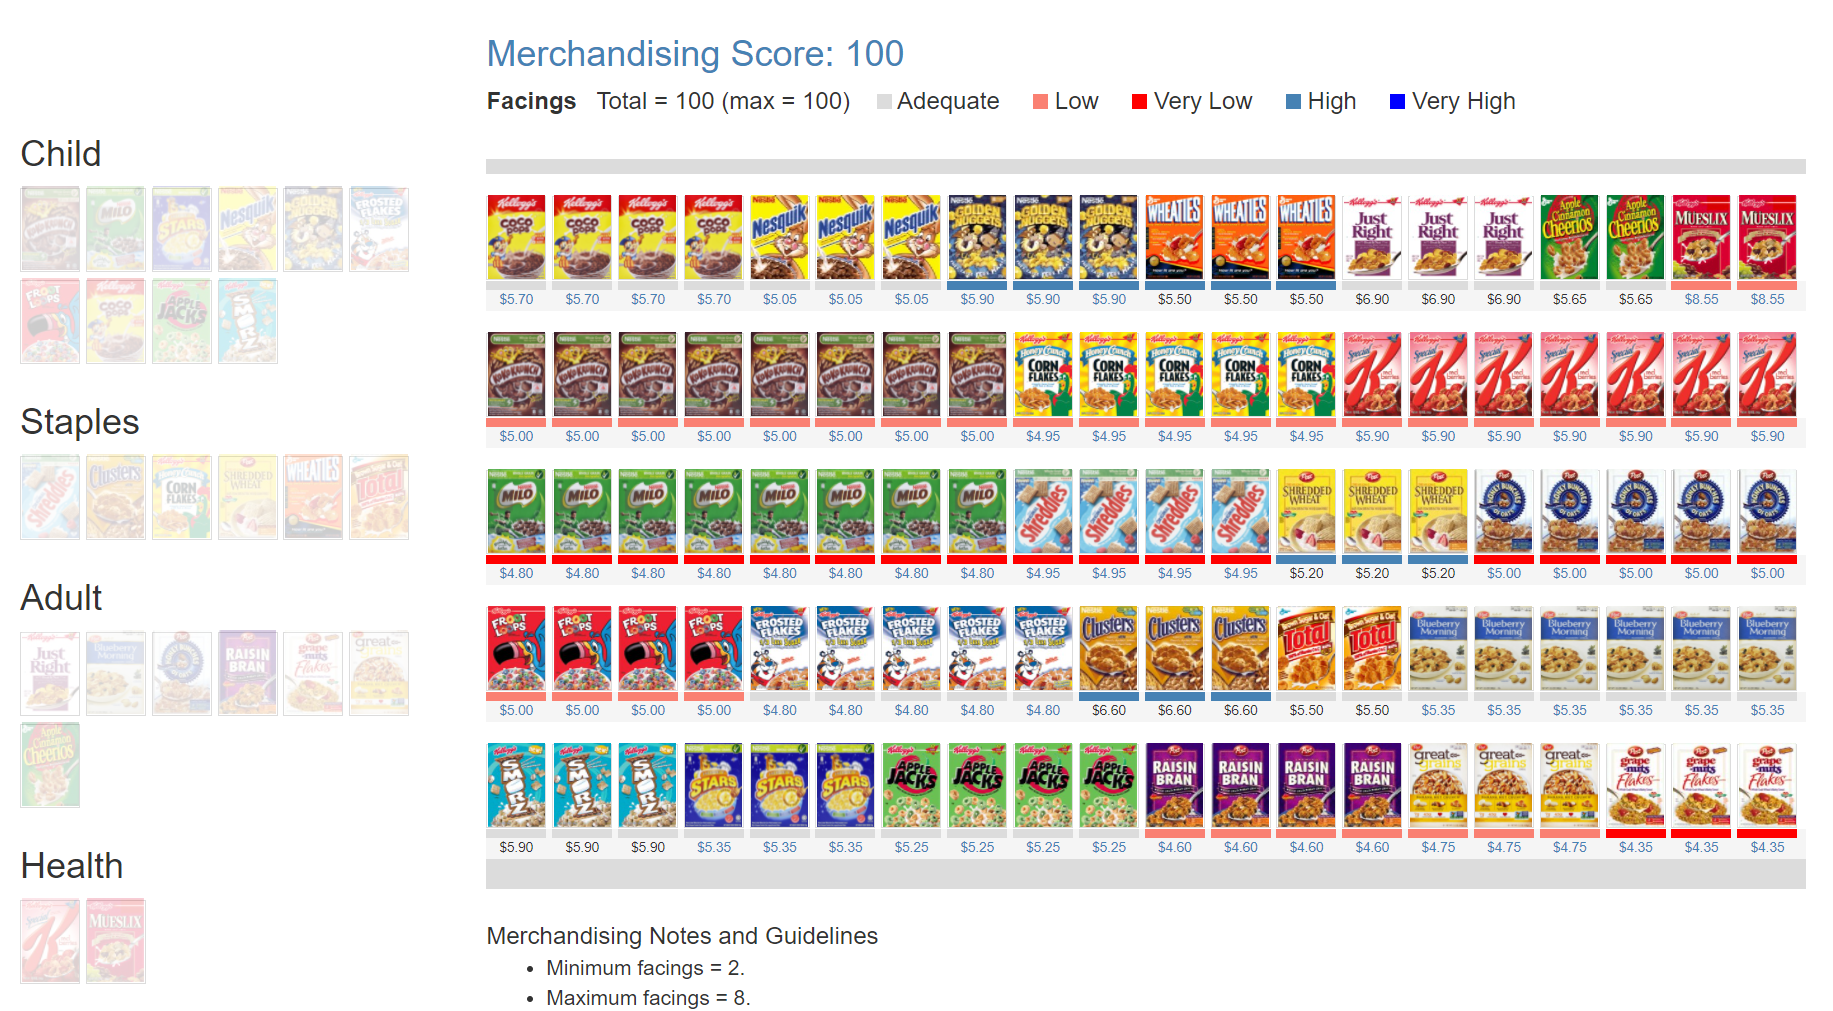
The Plannogrammer is an experiential learning facility for category managers, trade marketers, and retailers in consumer markets. Ideally suited for hybrid learning programmes, Plannogrammer imparts hands-on training in the planning and evaluation of promotions and merchandising.
It supports a collection of simulation and analysis platforms such as Promotions and Space Planner for optimizing space and promotions, Plannogram for populating shelves and merchandising, a Due To Analysis dashboard that decomposes brand sales into the factors driving sales, and a Promotion Evaluator to evaluate the volume, value and profit impact of promotion plans.


Contact | Privacy Statement | Disclaimer: Opinions and views expressed on www.ashokcharan.com are the author’s personal views, and do not represent the official views of the National University of Singapore (NUS) or the NUS Business School | © Copyright 2013-2026 www.ashokcharan.com. All Rights Reserved.