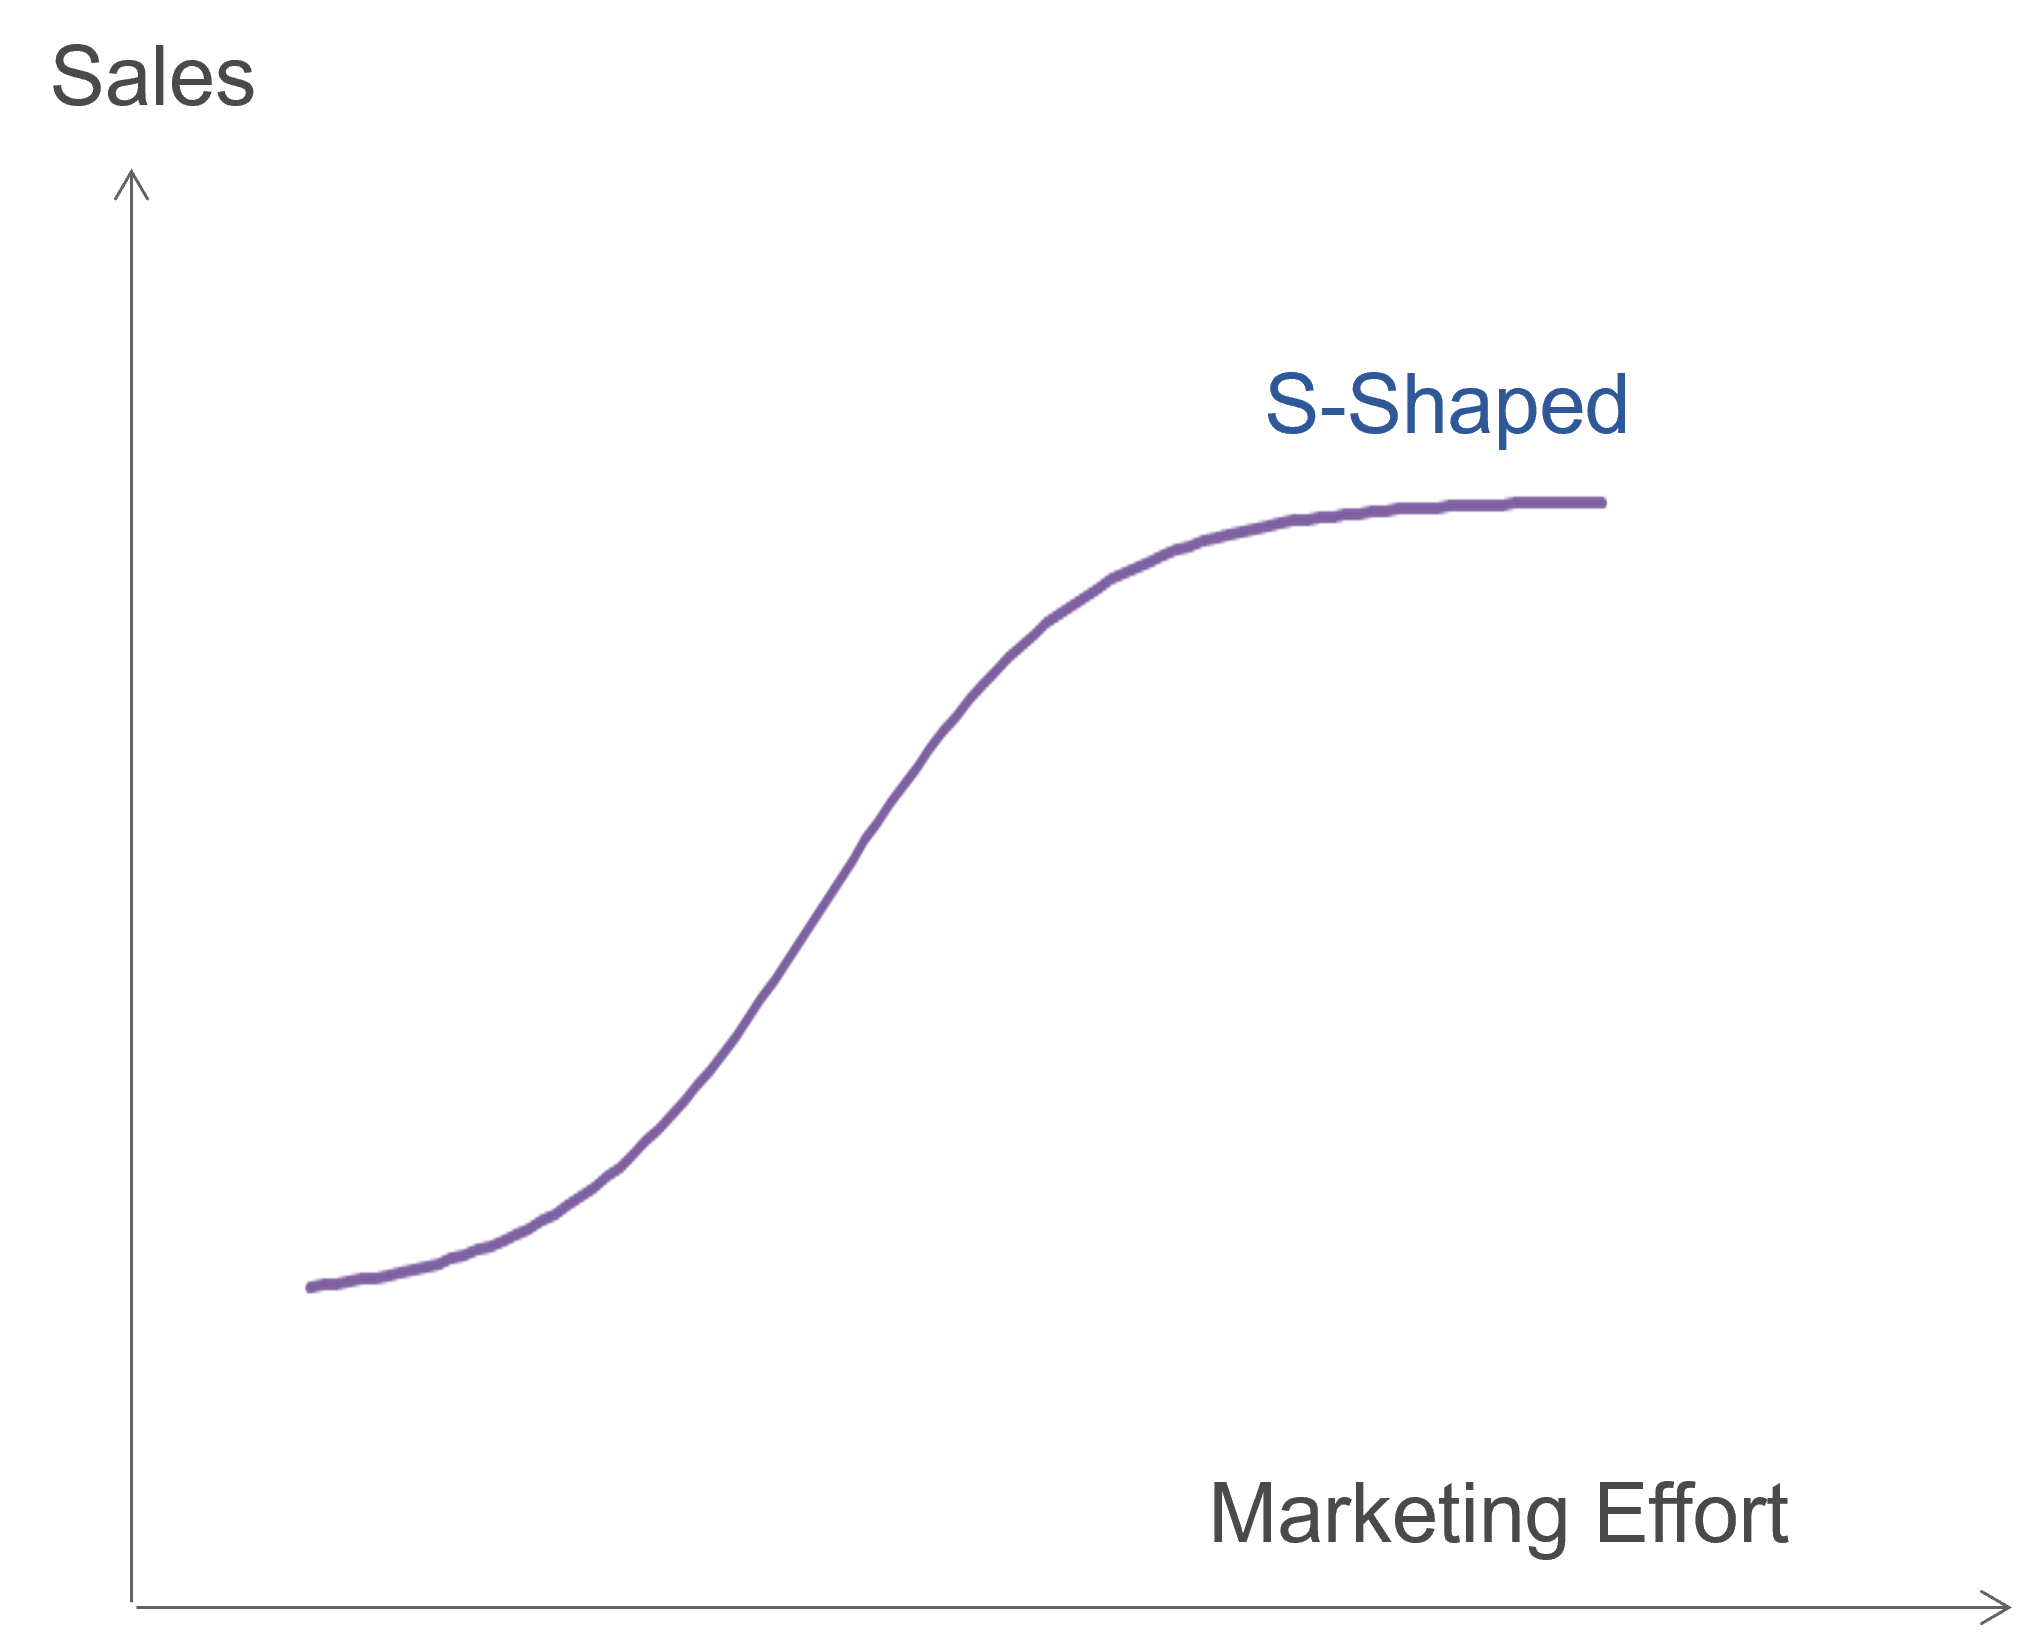
Exhibit 36.2-4 S-shaped Response Model.
The S-shaped response function exhibits increasing
returns to scale at low levels and diminishing returns at high levels of marketing effort.
This is particularly plausible for advertising, where low levels get drowned by the noise,
while very high levels may reach a saturation point.
The S-shape response function is also used for modelling the effect of shelf
space on sales in store. The S-shape captures the notions of threshold and
saturation. Below the threshold, marketing effort has no impact on sales, and above
saturation, there is no further increase in sales. Within these threshold and saturation
bounds, consumers become less responsive to the marketing stimuli.
The S-shaped response model has implications for how advertising should be
planned and executed. If the response truly reflects the relationship between advertising and
sales, it suggests different strategies for flighting advertising campaigns. An advertising
burst involves a concentrated and heavy dose of advertising over a short period,
designed to surpass the threshold levels. On the other hand, drip or continuous
advertising involves lighter and consistent advertising spread over a longer duration. If a
threshold exists, marketers should consider using less drip advertising unless it exceeds
the threshold, and instead focus more on burst or pulse advertising — a strategy
that alternates between periods of advertising and non-advertising over weeks or months.
While conceptually appealing, there is not much
empirical evidence to support the existence of an S-shape response to
advertising effort. It is hard to prove or disprove considering that historical
data tends to lie well within these theoretical upper and lower bounds.
The logistic model takes a functional form that
conforms to the S-shape:
$$ln \left( \frac{S-S_0}{S^0-S}\right)=α+βln(X), \,where \,0 \le S_0 \le S^0 $$
Where S is sales, the dependent variable, X is the independent variable representing the
marketing effort for the marketing mix element, S0 is the intercept and the threshold
level, and S0 is the saturation level.
The elasticity of demand, for a variable with an
S-shaped response with sales, follows an inverted bell-shape, starting at 0 at
threshold level to a maximum, and back to 0 at the saturation level.
A related but rare phenomenon is the notion of supersaturation.
It refers to the excessive use of a marketing instrument, such as advertising,
that theoretically may repulse consumers, creating a negative response to sales. It
is rarely witnessed because marketers’ budgets are usually constrained; they
operate below saturation levels and well below supersaturation levels. The
supersaturation effect can be represented by the quadratic model:
$$S=α+β_1X-β_2X^2$$