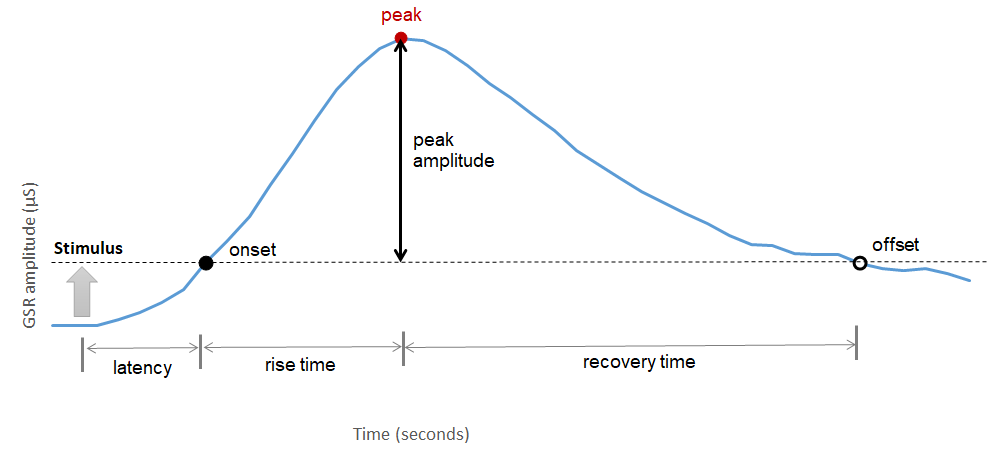
Exhibit 15.23 GSR response pattern and metrics.
Exhibit 15.23 displays the pattern that the
GSR follows. As previously mentioned, there is a latency period of a few seconds after the
stimulus is presented before the amplitude starts to rise. The onset of the stimulus is
automatically detected by setting a cut-off amplitude of, for instance, 0.01 µ.
The amplitude increases to a peak before returning to the baseline. The point at
which the GSR phasic returns to the baseline is considered the offset or the point of return.
The increase in amplitude from onset to peak is referred to as the peak amplitude, while the
time duration between onset and peak is called the rise time. Similarly, the time duration
from peak to offset is referred to as the recovery time.
Algorithms are able to detect the GSR pattern and record the metrics based on the
cut-offs defined above.


