The process of translating raw GSR signals into
meaningful information involves complex algorithms and signal processing techniques.
However, this is typically automated and does not require marketers to have a deep
understanding of the technical details. The output of the analysis is usually presented
in the form of graphs or charts that show changes in the respondent's level of arousal
or engagement over time. These visual representations can help marketers to identify
key moments of interest or emotional response during a particular experience or stimulus.
As previously mentioned, skin conductance is computed by measuring the
current flowing between the electrodes. The formula for computing conductance is:
$$ Ω=\frac{V}{A};\, Conductance,\, G=\frac{1}{Ω}=\frac{A}{V} $$
where Ω is ohm (resistance), V is volt, A is ampere and G is
conductance in siemens.
The formula for calculating skin conductance level (SCL) is:
$$ SCL=\frac{1}{T} \int_{t_1}^{t_2} G(t) dt $$
where T is the time interval, t1 and t2
are the start and end times, and G(t) is the conductance at time t.
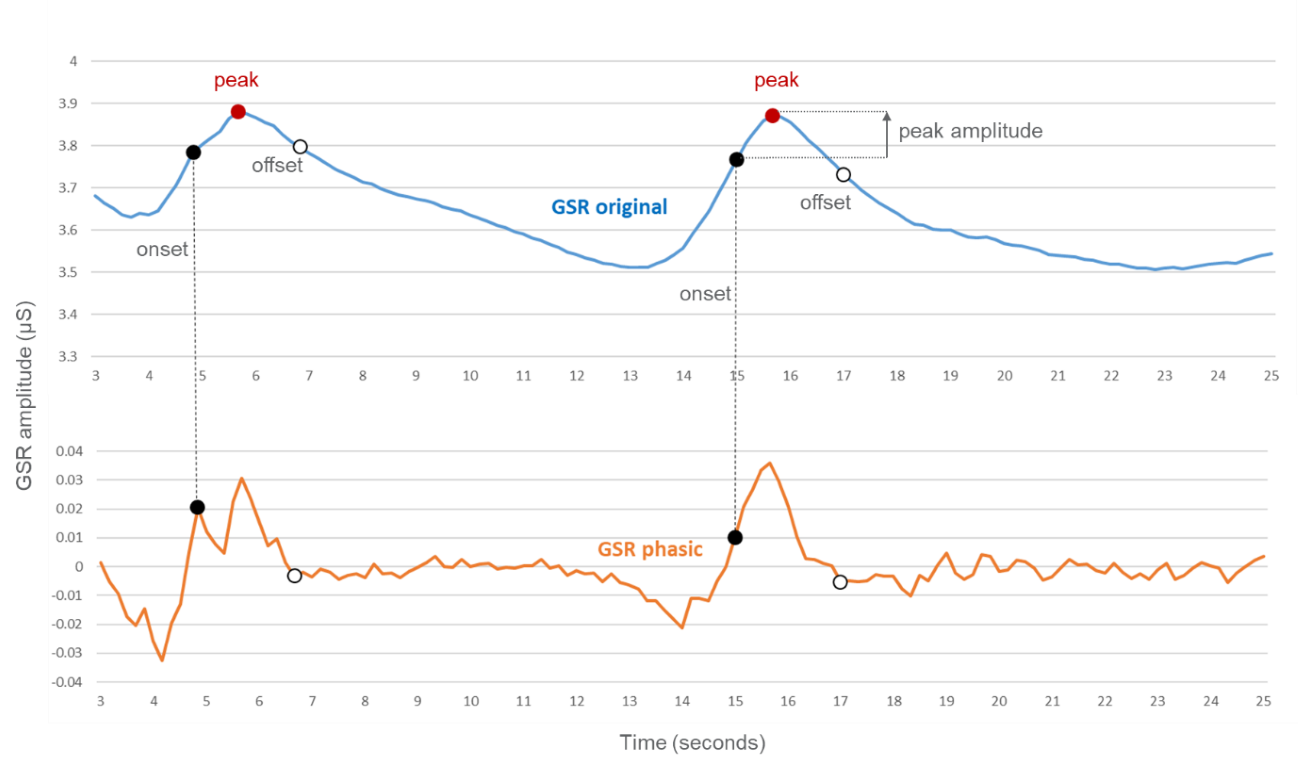
Exhibit 15.22 GSR original and phasic response patterns.
Filtering out the tonic level: The GSR signal has two main components – skin conductance level (SCL), also known as
the tonic level, and skin conductance response (SCR), or the phasic response.
The tonic level varies slowly over time, and from individual to individual. Moreover, since it is dependent on factors
other than emotional arousal, it is not of relevance for analysis purposes.
Because it moves much more gradually than the phasic response, the tonic component is approximately the same as the
smoothened GSR signal. It can be filtered out simply by applying a smoothing function and subtracting it from the data.
Take for example the data depicted in Exhibit 15.22, where the tonic level
is removed using a basic smoothing algorithm.
Baselining: Individuals have different baseline patterns of electrodermal activity. Some tend to have skin conductance
signals that do not vary much. These individuals are called stabiles. Others have many more skin conductance responses, even when
they are resting. These individuals are called labiles.
At the start of a recording, we need to establish the respondent’s baseline. A
neutral baseline is recorded when there are no stimuli, and the respondent is relaxed. The
respondent is then shown a video with content that should elicit a range
of positive and negative emotions. Responses to these stimuli help establish the respondent’s
baseline pattern.
Incidentally, stabiles and labiles tend to have different personalities. According to some studies a labile tends
to be more inhibited in emotional expression, whereas the stabile is more expressive and antagonistic. A stabile also has
difficulty maintaining attention over time and is more likely to fall asleep in boring situations.
Response time and test stimulus: To capture the complete pattern and
distinguish the responses clearly, it is important to note that there is a lag of 1 to 5
seconds between the appearance of the stimulus and the phasic response. Therefore, the
stimulus should be presented for at least 5 seconds. Additionally, a calming down stimulus
should be shown in between the test stimuli to allow the respondents to return to their
baseline state.


