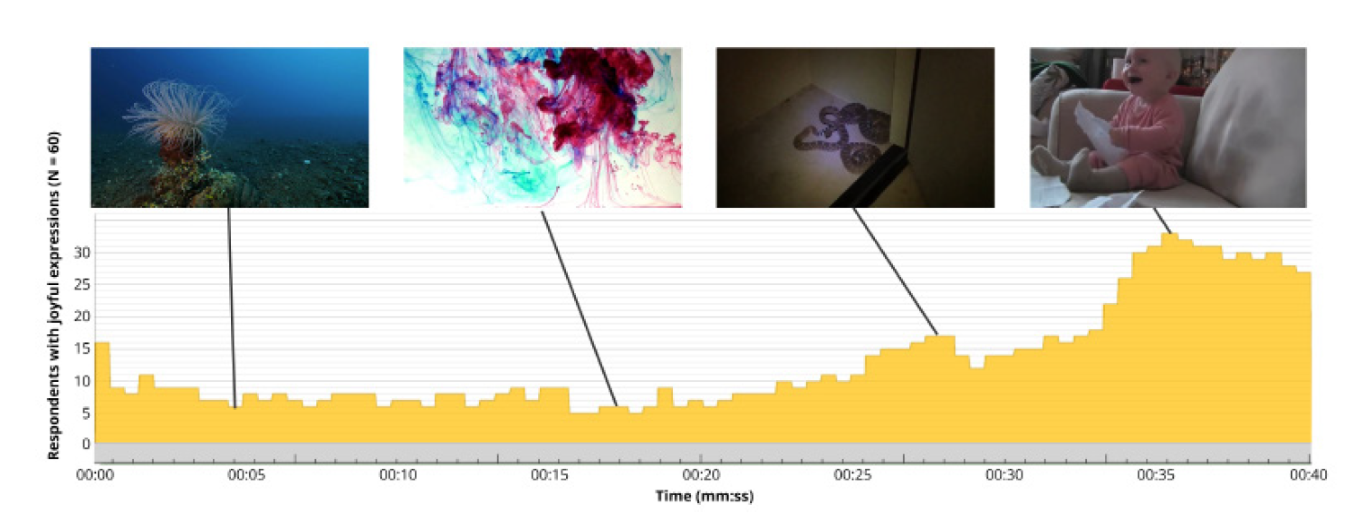
Exhibit 15.20 Data visualization. (Source: iMotions).
The input for the analysis of facial expressions is
essentially a video feed, either from a laptop, tablet, phone, GoPro, or standalone webcam.
The video is split into several short intervals or epochs (for instance, 1
second each), and a median facial expression score is computed for each respondent, over each
epoch, based on a signal threshold algorithm. Respondents are counted if their score exceeds
the threshold level.
This framework permits easy quantification and aggregation of the data. For
instance, consider Exhibit 15.20, pertaining to the analysis of a video. It depicts the number
of respondents with joyful expressions over the course of the video.
A typical analysis would comprise a series of similar charts
relating to different emotions, facial expressions, as well as metrics pertaining to engagement and sentiment valence.
The information is auto-generated and is easy to interpret.


