
-
Biometrics
Biometrics
Eye Tracking
How it Works
Devices
Metrics
Fixations and Saccades
Heat Maps
Pupillometry
Eye Language
Applications
Electroencephalography
Frequency-based Analysis
Metrics
Approach-Avoidance
Cognitive-Affective
Facial Coding
Facial Expressions
Facial Action Coding System
Metrics
Analysis
Applications
Galvanic Skin Response
Devices
Analysing GSR Signals
Metrics
Applications
Biometrics — Applications
- How Advertising Works
- Advertising Analytics
- Packaging
- Biometrics
- Marketing Education
- Is Marketing Education Fluffy and Weak?
- How to Choose the Right Marketing Simulator
- Self-Learners: Experiential Learning to Adapt to the New Age of Marketing
- Negotiation Skills Training for Retailers, Marketers, Trade Marketers and Category Managers
- Simulators becoming essential Training Platforms
- What they SHOULD TEACH at Business Schools
- Experiential Learning through Marketing Simulators
-
MarketingMind
Biometrics
Biometrics
Eye Tracking
How it Works
Devices
Metrics
Fixations and Saccades
Heat Maps
Pupillometry
Eye Language
Applications
Electroencephalography
Frequency-based Analysis
Metrics
Approach-Avoidance
Cognitive-Affective
Facial Coding
Facial Expressions
Facial Action Coding System
Metrics
Analysis
Applications
Galvanic Skin Response
Devices
Analysing GSR Signals
Metrics
Applications
Biometrics — Applications
- How Advertising Works
- Advertising Analytics
- Packaging
- Biometrics
- Marketing Education
- Is Marketing Education Fluffy and Weak?
- How to Choose the Right Marketing Simulator
- Self-Learners: Experiential Learning to Adapt to the New Age of Marketing
- Negotiation Skills Training for Retailers, Marketers, Trade Marketers and Category Managers
- Simulators becoming essential Training Platforms
- What they SHOULD TEACH at Business Schools
- Experiential Learning through Marketing Simulators
Eye Tracking

Eye tracking is a technique that measures the point of gaze, or where a person is looking, by tracking the movement of the eye. Eye trackers (Exhibit 15.2) record what people see and how long they focus on certain areas of interest.
The use of eye tracking in market research dates back to the 1800s, where early studies revealed that when people read text, their eyes make short, rapid movements (saccades) intermingled with short stops (fixations).
In the past, the use of eye tracking in market research was limited because the tracking devices used to be intrusive, cumbersome, and expensive. However, recent advances in technology have led to the development of non-intrusive, easy-to-use devices that allow for precise and objective measurements of eye movements in real-time, even in natural settings.
As eye tracking continues to become more widely adopted, the cost of eye tracking devices is expected to decrease, making them more accessible for consumer research. This is likely to further accelerate their use in market research, opening up new possibilities for marketers to gain insights into consumer behaviour and preferences.
How it Works
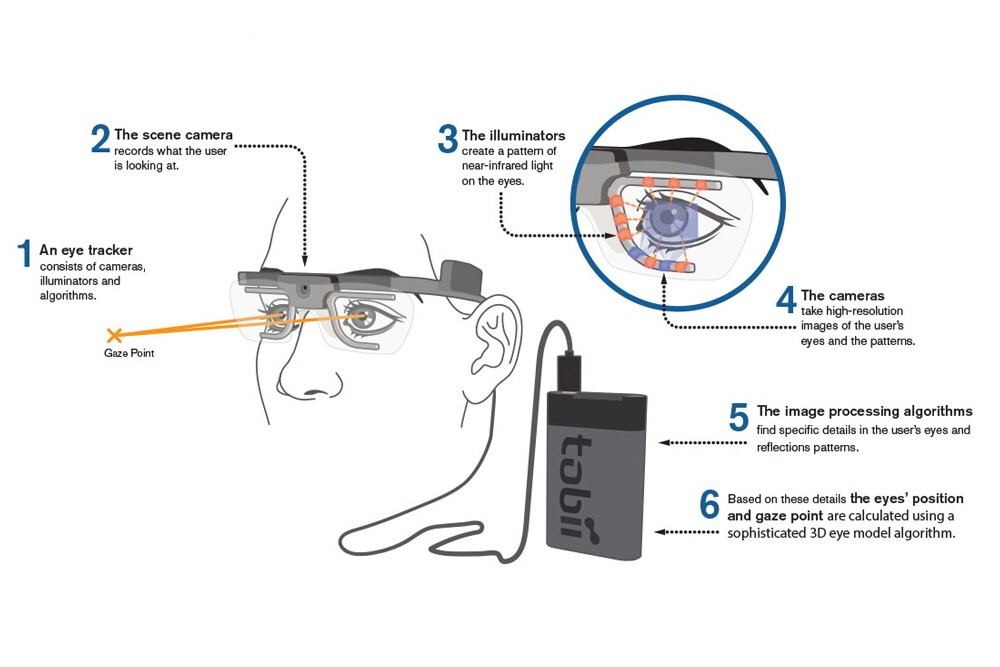
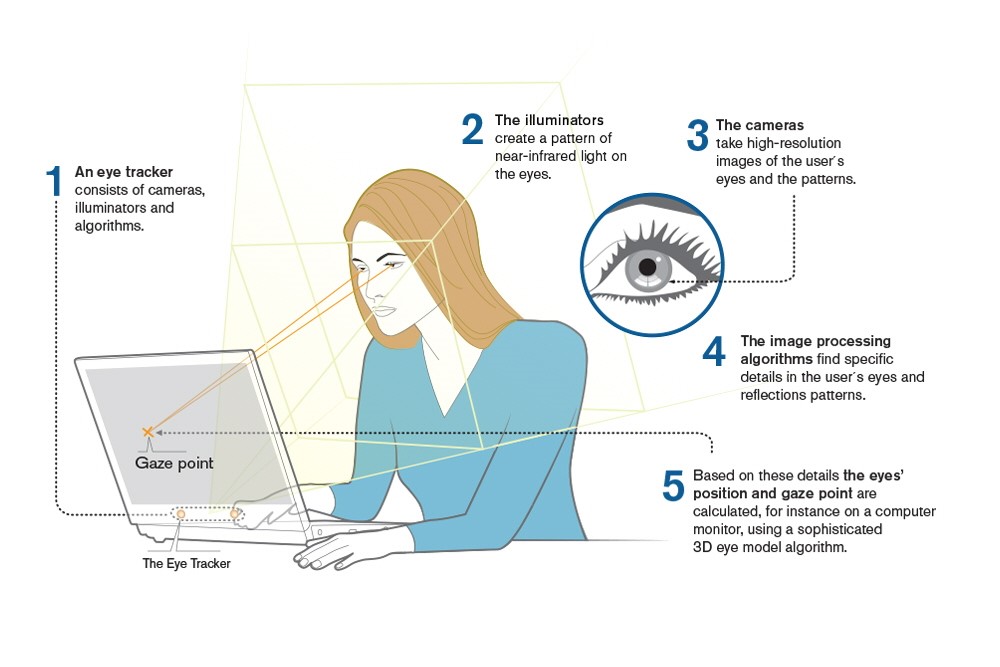
Eye trackers use near-infrared light-emitting diodes (LEDs) to illuminate the eye while the user looks at a screen or object. Cameras fitted onto the device then record the reflections of the light, and computer algorithms analyse the reflections to determine the direction of the gaze. This underlying concept is known as pupil centre corneal reflection (PCCR) and is commonly used in eye tracking technology (as shown in exhibits 15.3 and 15.4).
The LED light source emits light at a wavelength outside the visible spectrum, which is not visible to the user but can be detected by the near-infrared cameras fitted onto the eye tracker.
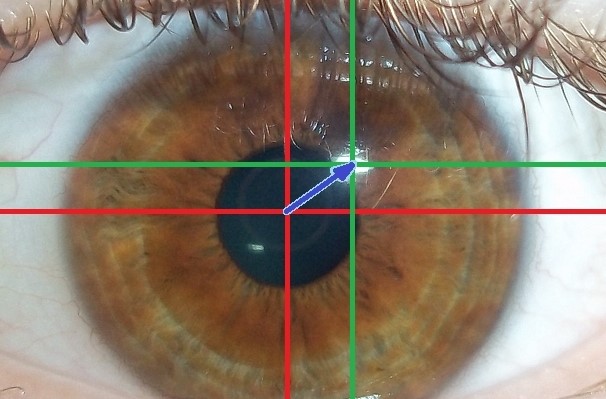
Exhibit 15.5 Pupil centre corneal reflection: the vector (blue) formed by reflections from the pupil (red) and the cornea (green), reveals the direction of the gaze. (Source of image: Wikipedia).
Light that falls on the pupil, enters through the pupil, whereas light that falls on the cornea outside the pupil, is reflected back. The camera records the pupil as a dark spot, while corneal reflections are brighter, allowing the computer algorithms to process the vector (refer to Exhibit 15.5) formed by the reflection from the pupil and the cornea to detect the direction of the gaze. This is referred to as dark pupil eye tracking.
If the LED light source is coaxial with the optical path, it reflects off the retina, creating a bright pupil effect similar to red-eye. As with dark spot, in bright pupil eye tracking the reflection of the pupil is different than the rest of the eye and can be used by computer algorithms to process the vector formed by the reflection from the pupil and the cornea which can then be analysed to determine the direction of the gaze.
To track real or virtual 3-dimensional space, the cameras need to observe and combine the gaze from both eyes. Additionally, because our eyes are not identical in size, shape, or structure, a simple calibration procedure is required before use to ensure accurate tracking.
Devices
The two most commonly available types of eye trackers are glasses (wearable and mobile) and screen-based (remote or desktop) trackers. Glasses, such as the Tobii Pro Glasses 2 (Exhibit 15.6), are lightweight, weighing about 50g, and allow for tracking of respondents’ eyes as they move freely in a real or virtual setting. These devices come with a wired or wireless recording unit and have 4 eye cameras, with a gaze sampling frequency ranging from 50 or 100 Hz. They are suitable for a wide range of consumer research, including packaging testing, advertising testing, usage studies, and shopping behaviours.
On the other hand, screen-based eye trackers (Exhibit 15.7) are typically mounted under a computer screen and are used in lab settings or controlled location tests (CLT) for testing a wide variety of media, including videos and images, for both online and offline content. These trackers are also used in consumer research for copy testing and packaging testing.
Metrics
Eye tracking quantifies visual attention, with the most common metrics being fixations and saccades. Fixations refer to the stable points where the eye remains fixated for a period of around 100 milliseconds or more, while saccades refer to the rapid movements between fixations.
Fixations and Saccades
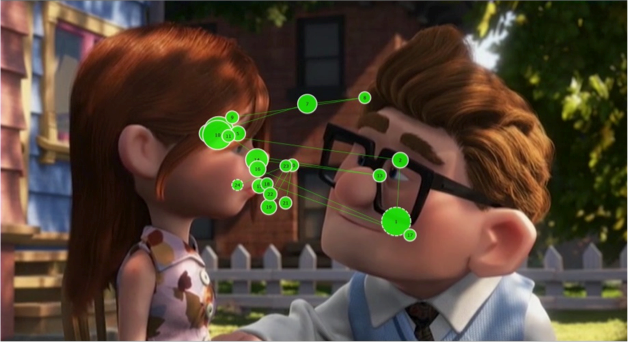
Exhibit 15.8 Gaze plot of a viewer in a scene from the movie Up. (Source: How we came to Eye Tracking Animations — Craig Batty, Claire Perkins and Jodi Sita.)
Gaze point is the basic unit of measure of eye gaze. If the eye tracker has a sampling frequency of 60 Hz, it captures 60 gaze points per second (or one every 16.67 milliseconds).
A cluster of gaze points, close in time and space, constitutes a fixation. While there is no precise cut-off defining a fixation, it is believed that durations less than 300ms do not get encoded in memory. In practice, devices are recoding fixations for periods of 100ms or more.
The eye movements between fixations are called saccades. They are the lines that connect the different fixations.
When viewing an image or reading a text, longer fixation time might mean that the object in focus is more engaging, or it could indicate difficulty in understanding or extracting information. More fixations indicate that the object is more noteworthy, whereas faster time to first-fixation means that it better at grabbing attention.
A scan path or gaze plot describes the user’s gaze pattern as a saccade-fixate-saccade sequence represented by lines and bubbles, where the size of the bubble indicates the fixation duration. The gaze plot in Exhibit 15.8 involves a jerky movement from one fixation to another. This is typical of most visual images and videos. Similarly, while reading text, eyes tend to jump and pause.
When driving a vehicle, on the other hand, eyes fixate constantly on the road or the vehicle in front. There are much fewer saccades and a smoother, more concentrated scan path.
Heatmaps
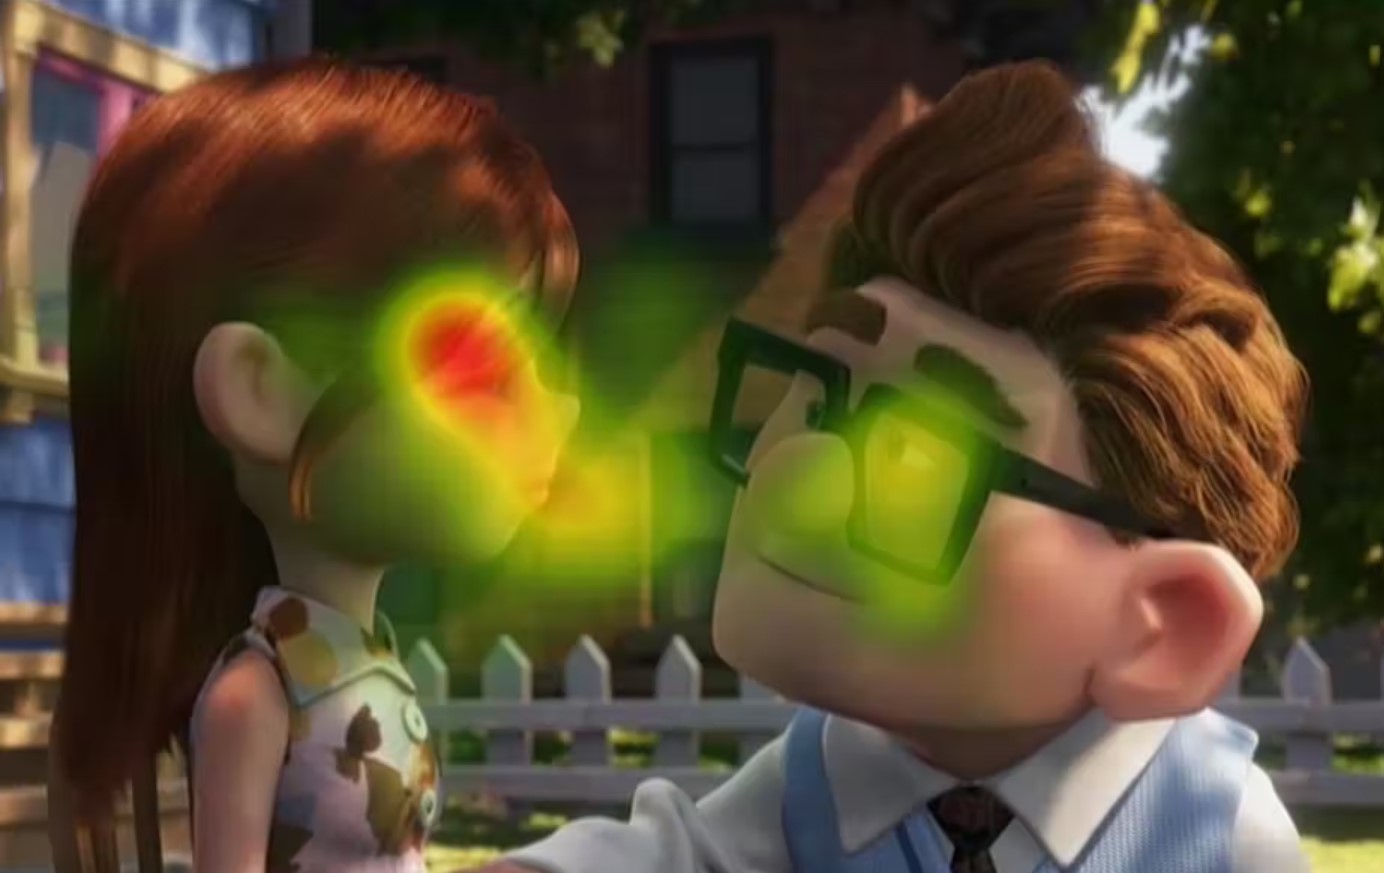
Exhibit 15.9 Heatmaps depict hot spots of areas that are grabbing eyeballs. (Source: Dr Jodi Sita, Australian Catholic University.)
Heatmaps like the one in Exhibit 15.9, represent the areas of the visual that are viewed most. They depict the aggregate gaze points through a colour scheme where warm colours like red and yellow indicate hot spots or areas that are viewed more often and for longer periods.
The “heat intensity” is equal to the proportion of participants fixating the area of interest times the average fixation duration, or time spent.
These metrics are of considerable relevance to marketing analysts. Advertisers, for instance, design layouts so that higher proportion of viewers (proportion fixating) see the value proposition or the key messages in the advertisement. Similarly packaging designers want their packaging to stand out on the shelf. It is important for both, that the key elements in their content are red hot spots.
Pupillometry
Our pupils respond to light, dilating when it is dark and constricting when it is bright. Pupils also respond to emotional arousal and cognitive or mentally taxing activity. They dilate when the mind is emotionally charged or cognitively stimulated, and the extent of dilation is proportional to the intensity of the arousal. It is an autonomic process that cannot be consciously controlled.
Pupillometry, which measures the dilation of the pupil, can provide an assessment of emotional arousal, provided that the impact of lighting is taken into account. However, it is important to note that pupillary responses do not reveal the specific nature of the emotions being experienced. Therefore, it is necessary to combine pupillometry with other conventional or biometric research techniques, to gain a more detailed understanding of emotions.
Eye Language
Besides pupillary responses, eye trackers measure a range of other aspects of body language, or more specifically, “eye language” that provide insights into the user’s state of mind. One of these is ocular vergence, which is tracked by measuring the inter-pupillary distance. When the eyes move apart (divergence), it can signal that the user’s mind is drifting, losing focus, or lacking concentration.
Eye trackers also monitor frequency of blinks, which can reveal information about the user’s mental state. Delayed or “attentional” blinking is indicative of mentally taxing work, while low-frequency blinking indicates deeper levels of concentration. Conversely, high frequency blinking is associated with boredom, drowsiness and low concentration levels.
Another body metric that can be measured is the distance between the eyes and the screen, which reflects the user’s posture. Leaning forward is often a sign of positive resolution or a higher level of interest, while leaning backward may suggest negativity or an inclination to avoid. By analysing these various aspects of eye language, eye tracking can provide a more nuanced understanding of the user’s behaviour and mental state.
Applications
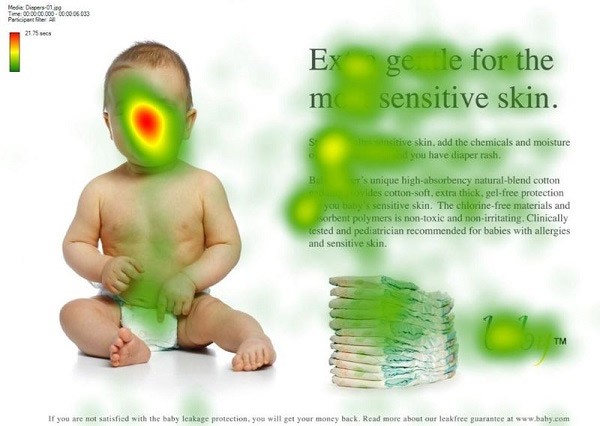
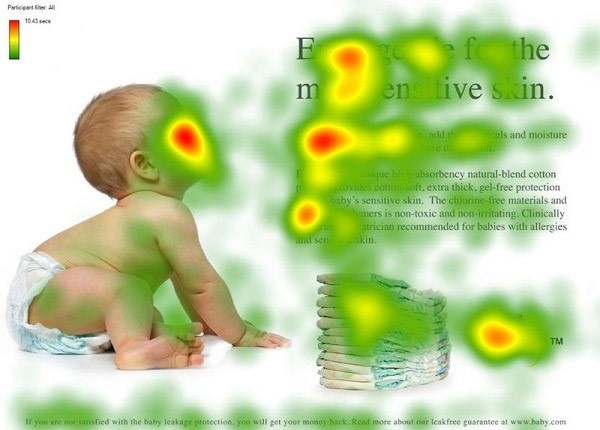
Exhibit 15.10 Use of heat maps to illustrate the differences in impact between two versions of an ad. Lower version succeeds in drawing attention to the advertising messages by the suggestive directional cue of the baby gazing at the text. (Source: Kissmetrics).
The use of eye tracking in consumer research is expected to grow rapidly in the coming years, with primary applications including testing of advertising, packaging, product usage, websites, and other online content.
For example, eye tracking can reveal how the layout of an advertisement or webpage affects viewers’ attention and comprehension. Heat maps generated by eye tracking can show which areas of an image or text viewers are fixating on, allowing marketers to optimize their design for maximum impact.
In the oft quoted example shown in Exhibit 15.10, there are key differences in the heat maps for two similar diaper advertisements. In the first version of the ad where the baby is facing the viewers, they are focussed mainly on the baby’s face. This visual may score on viewership but it fails to generate the right kind of attention.
In contrast, the lower version of the ad, succeeds in drawing attention to the advertising messages by using the suggestive directional cue of the baby gazing at the text. This subtly draws viewers’ attention to the key messages contained in the text of the advertisement.
Eye tracking can also be used to assess emotional arousal through pupil dilation, although additional biometric techniques such as facial coding or EEG may be needed to decipher the nature of the emotions being experienced.
While testing applications like websites, eye tracking is used to assess usability and user experiences. The fixation time, for instance, is an indicator of the ease of absorbing information. Excessive time spent reading general information or basic instructions may indicate difficulties in understanding the content, resulting in a negative user experience.
The time to first-fixation reveals the extent to which key elements are able to grab viewers’ attention. A key metric for packaging testing the time to first-fixation captures the packaging’s ability to stand out on the shelf.
Eye tracking may also be used for studying the usage of products that require skill and familiarity from the user, such as computer games, computer-aided applications, automobiles, airplanes, and sports product. In the field of Human computer interaction (HCI), eye tracking is becoming increasingly important for designing better computer systems and software applications. By studying users’ eye movements, engineers and designers gain insights into how people interact with technology, and use these insights to improve the user experience.
Simulators for automobiles (or airplanes) use eye tracking and other sensors to understand how drivers drive, and how they respond to danger and obstacles on the road. The devices can reveal how speeding and reckless driving can impair visual attention, and help engineers build safer and easier to use products.
Eye trackers have the potential to become integral to products that utilize the information these devices capture. For instance, automobiles with eye tracking technology can be designed to respond to the driver’s gaze, eye movements, or pupil dilation. If the driver’s eyes stray off the road or if the driver starts falling asleep, the vehicle could be designed to respond accordingly to prevent an accident.
There is scope for use of eye tracking in interactive television and in applications that are interactive in nature.
There is considerable scope too, largely untapped for now, in virtual reality simulation. By using eye tracking, users can seamlessly navigate virtual environments by simply looking at the desired location or object. This enhances the overall user experience and makes virtual simulations more realistic, making them more useful for consumer research such as simulated store tests and virtual in-store shopping behaviour studies.
However, eye tracking has limitations, as it only shows where the eyes are headed and not what the mind perceives. Sometimes the mind is so preoccupied, that the eyes do not register what lies in the direction of their ray of sight. For instance, when someone looks right through you. Or for instance when a banner ad is the viewer’s line of sight, but she is not perceiving it.
To fully understand respondents’ perceptions and emotions, eye tracking needs to be used in conjunction with research and analytic techniques in conventional quantitative and qualitative research as well as other biometric tools like EEG and facial coding.
Eye tracking is used in conjunction with EEGs to identify the elements in a visual that stir emotions, and with facial coding devices to reveal the aspects that evoke facial expressions. Details of how eye tracking may be used in conjunction with other biometric devices, are covered in the section Applications of Biometrics in Marketing.
Previous Next
Use the Search Bar to find content on MarketingMind.


Contact | Privacy Statement | Disclaimer: Opinions and views expressed on www.ashokcharan.com are the author’s personal views, and do not represent the official views of the National University of Singapore (NUS) or the NUS Business School | © Copyright 2013-2026 www.ashokcharan.com. All Rights Reserved.