-
Biometrics
Biometrics
Eye Tracking
How it Works
Devices
Metrics
Fixations and Saccades
Heat Maps
Pupillometry
Eye Language
Applications
Electroencephalography
Frequency-based Analysis
Metrics
Approach-Avoidance
Cognitive-Affective
Facial Coding
Facial Expressions
Facial Action Coding System
Metrics
Analysis
Applications
Galvanic Skin Response
Devices
Analysing GSR Signals
Metrics
Applications
Biometrics — Applications
- How Advertising Works
- Advertising Analytics
- Packaging
- Biometrics
- Marketing Education
- Is Marketing Education Fluffy and Weak?
- How to Choose the Right Marketing Simulator
- Self-Learners: Experiential Learning to Adapt to the New Age of Marketing
- Negotiation Skills Training for Retailers, Marketers, Trade Marketers and Category Managers
- Simulators becoming essential Training Platforms
- What they SHOULD TEACH at Business Schools
- Experiential Learning through Marketing Simulators
-
MarketingMind
Biometrics
Biometrics
Eye Tracking
How it Works
Devices
Metrics
Fixations and Saccades
Heat Maps
Pupillometry
Eye Language
Applications
Electroencephalography
Frequency-based Analysis
Metrics
Approach-Avoidance
Cognitive-Affective
Facial Coding
Facial Expressions
Facial Action Coding System
Metrics
Analysis
Applications
Galvanic Skin Response
Devices
Analysing GSR Signals
Metrics
Applications
Biometrics — Applications
- How Advertising Works
- Advertising Analytics
- Packaging
- Biometrics
- Marketing Education
- Is Marketing Education Fluffy and Weak?
- How to Choose the Right Marketing Simulator
- Self-Learners: Experiential Learning to Adapt to the New Age of Marketing
- Negotiation Skills Training for Retailers, Marketers, Trade Marketers and Category Managers
- Simulators becoming essential Training Platforms
- What they SHOULD TEACH at Business Schools
- Experiential Learning through Marketing Simulators
Galvanic Skin Response
Galvanic skin response (GSR), also referred to as skin conductance response (SCR) or electrodermal activity (EDA), is the property that momentarily makes our skin a better conductor of electricity when we are physiologically aroused.
When aroused, a number of body processes get activated – for instance, our heart beats faster and pulse rises. We also sweat more, and as we sweat our skin conductance increases.
So, GSR is essentially triggered by sweating, and is measured in micro-Siemens (µS) or micro-Mho (µM). Recent research has shed light on the complexities of this phenomenon, but practitioners need not necessarily delve into the finer details.
Arousal is one of the two main dimensions of emotion, the other being valence. GSR can capture emotional arousal, or the level of stimulation, and this makes it a strong predictor of attention and memory. It does not reveal emotional valence, i.e., it is unable to detect whether we are feeling good (positive) or whether we are feeling bad (negative). In this respect, GSR and facial coding are complementary. Facial coding captures the valence of emotion but cannot gauge the associated arousal.
Since sweat secretion cannot be consciously controlled, GSR is able to track autonomic arousals. This is what makes it a non-deceptive indicator of our emotions. It also explains its use along with other technologies, in lie-detection.
The other prime advantage is that GSR is relatively inexpensive and easy-to-measure, requiring fairly simple devices.
Devices
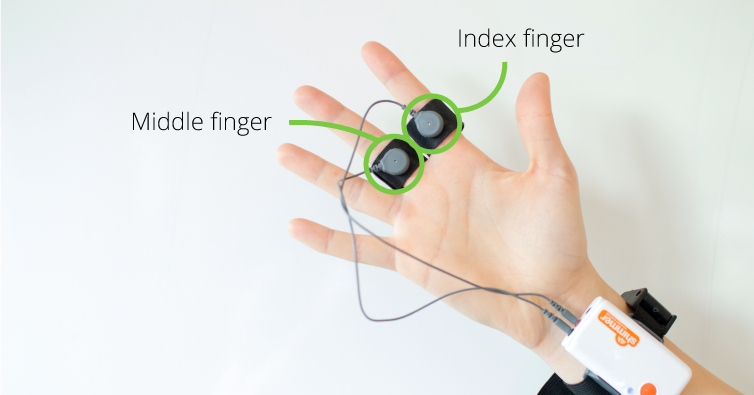
A GSR sensor is a non-invasive device that requires minimum preparation and calibration. The operation is fairly straightforward. Two electrodes are placed where there is high density of the eccrine sweat glands, such as fingers, palms or the soles of the feet. A low voltage is applied, and the skin conductance is computed by measuring the current flowing between the electrodes.
The fingers, palms and foot soles are the parts of the body that respond to emotional and other psychological stimuli. As shown in Exhibit 15.21, the middle and index finger are ideal locations to place the electrodes, typically on the non-dominant hand so that respondent is free to use the dominant hand.
If respondents need to use their fingers, such as for typing, then the palm is an option, or else the inner side of the sole of the foot.As can be seen from the exhibit, the electrodes are mounted on Velcro straps. The device is easily worn by fastening the straps.
In addition to the electrodes, the device comprises of an amplifier to boost the signal and a digitizer to convert the analog signal to digital.
Analysing GSR Signals
The process of translating raw GSR signals into meaningful information involves complex algorithms and signal processing techniques. However, this is typically automated and does not require marketers to have a deep understanding of the technical details. The output of the analysis is usually presented in the form of graphs or charts that show changes in the respondent's level of arousal or engagement over time. These visual representations can help marketers to identify key moments of interest or emotional response during a particular experience or stimulus.
As previously mentioned, skin conductance is computed by measuring the current flowing between the electrodes. The formula for computing conductance is: $$ Ω=\frac{V}{A};\, Conductance,\, G=\frac{1}{Ω}=\frac{A}{V} $$
where Ω is ohm (resistance), V is volt, A is ampere and G is conductance in siemens.
The formula for calculating skin conductance level (SCL) is: $$ SCL=\frac{1}{T} \int_{t_1}^{t_2} G(t) dt $$
where T is the time interval, t1 and t2 are the start and end times, and G(t) is the conductance at time t.
Filtering out the tonic level: The GSR signal has two main components – skin conductance level (SCL), also known as the tonic level, and skin conductance response (SCR), or the phasic response.
The tonic level varies slowly over time, and from individual to individual. Moreover, since it is dependent on factors other than emotional arousal, it is not of relevance for analysis purposes.
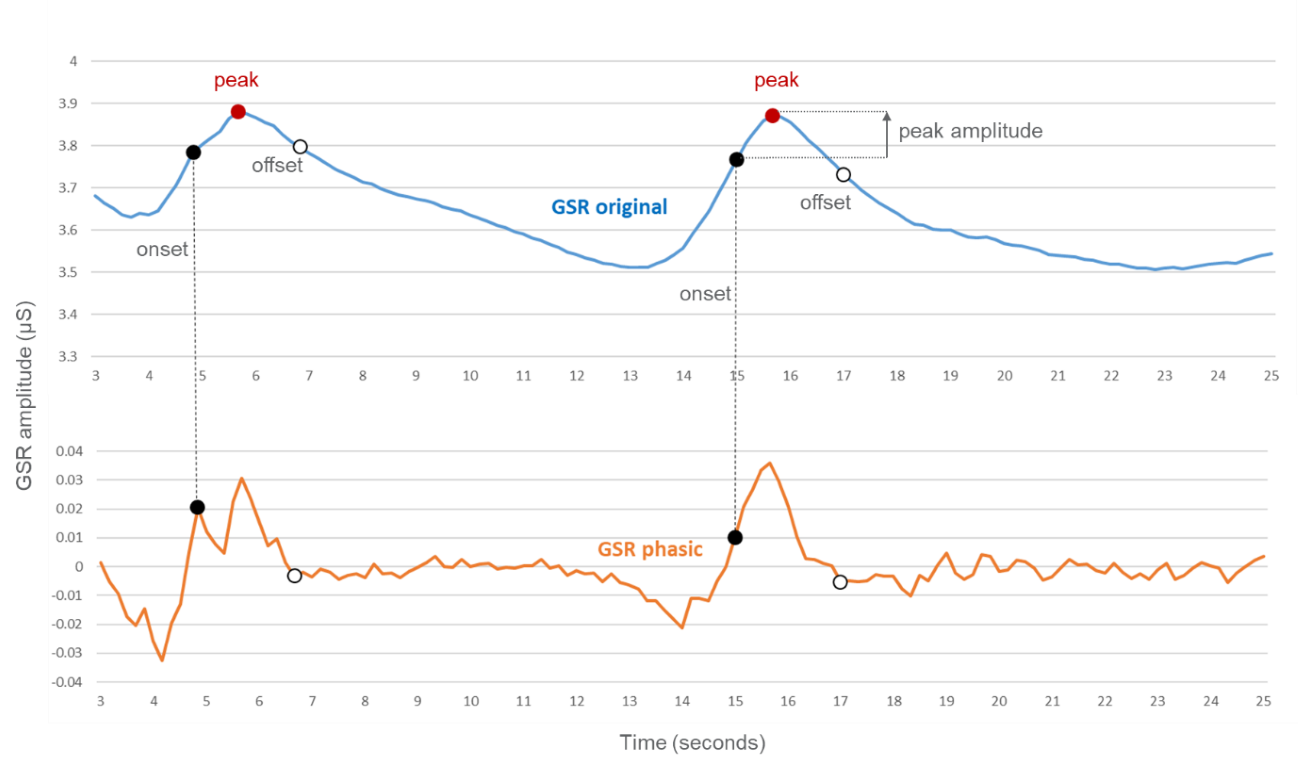
Because it moves much more gradually than the phasic response, the tonic component is approximately the same as the smoothened GSR signal. It can be filtered out simply by applying a smoothing function and subtracting it from the data.
Take for example the data depicted in Exhibit 15.22, where the tonic level is removed using a basic smoothing algorithm.
Baselining: Individuals have different baseline patterns of electrodermal activity. Some tend to have skin conductance signals that do not vary much. These individuals are called stabiles. Others have many more skin conductance responses, even when they are resting. These individuals are called labiles.
At the start of a recording, we need to establish the respondent’s baseline. A neutral baseline is recorded when there are no stimuli, and the respondent is relaxed. The respondent is then shown a video with content that should elicit a range of positive and negative emotions. Responses to these stimuli help establish the respondent’s baseline pattern.
Incidentally, stabiles and labiles tend to have different personalities. According to some studies a labile tends to be more inhibited in emotional expression, whereas the stabile is more expressive and antagonistic. A stabile also has difficulty maintaining attention over time and is more likely to fall asleep in boring situations.
Response time and test stimulus: To capture the complete pattern and distinguish the responses clearly, it is important to note that there is a lag of 1 to 5 seconds between the appearance of the stimulus and the phasic response. Therefore, the stimulus should be presented for at least 5 seconds. Additionally, a calming down stimulus should be shown in between the test stimuli to allow the respondents to return to their baseline state.
Metrics
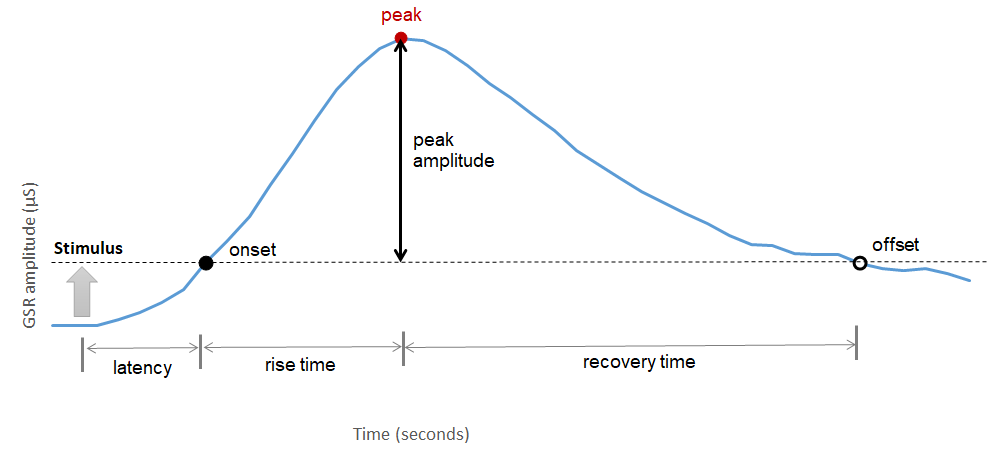
Exhibit 15.23 displays the pattern that the GSR follows. As previously mentioned, there is a latency period of a few seconds after the stimulus is presented before the amplitude starts to rise. The onset of the stimulus is automatically detected by setting a cut-off amplitude of, for instance, 0.01 µ.
The amplitude increases to a peak before returning to the baseline. The point at which the GSR phasic returns to the baseline is considered the offset or the point of return. The increase in amplitude from onset to peak is referred to as the peak amplitude, while the time duration between onset and peak is called the rise time. Similarly, the time duration from peak to offset is referred to as the recovery time.
Algorithms are able to detect the GSR pattern and record the metrics based on the cut-offs defined above.
Applications
Marketing applications of GSR include product development, packaging development, copy testing, and testing of websites.
Typically, respondents at a controlled location, strapped with GSR sensors, are exposed to the stimulus that is to be tested. Key metrics such as the number of peaks, and the peak amplitude are recorded for each respondent, and averaged across the total sample as well as relevant demographics.
The GSR metrics quantify the emotional arousal of the individuals, sub-groups, as well as the total sample. Marketers can compare the arousal level for different prototypes, or they can compare the metrics against benchmarks to gauge the prototype’s performance.
Common analysis includes comparison of peaks per minute and highs and lows across respondents.
For instance, consider advertising. If the objective of an advertisement video is to penetrate consumers’ minds associating the brand with positive or negative emotional states, then GSR can help determine if this objective is likely to be met. More peaks per minute and peaks of higher amplitude would indicate that respondents are experiencing frequent emotional arousals of greater intensity.
Importantly, while GSR is indicative of emotional arousal, it is not an indicator of emotional valence (positive/negative). So, one should consider using it in combination with other devices such as facial coders that are able to capture the nature of respondent’s emotions.
Biometrics Applications
Biometrics has wide ranging applications in marketing, and though its use has been growing rapidly, the potential largely remains under-utilized. The most promising application areas include copy testing, packaging development, product development, and testing of websites.
Programmes should ideally combine biometrics with conventional research, usually qualitative, but quite often quantitative as well. Moreover, biometric devices should be used in conjunction, as they complement one another to provide a holistic understanding.
Eye tracking is often the central component as it synchronizes the responses from other sensors with the elements that the consumer is gazing at, so that marketers know exactly what is triggering the emotions. Gaze plots and heat maps reveal what attracts the consumer’s attention, and how she visually consumes the elements of whatever is being tested. The tracking of pupil dilation also provides an assessment of emotional arousal.
Galvanic skin response (GSR) is a useful gauge of emotional arousal, or the intensity of the emotional charge. However, as with eye tracking, it does not reveal emotional valence, so we are unable to tell whether the emotions are positive or whether they are negative. To gauge this important dimension, GSR should be used with facial coding.
The prime advantages of GSR are that it is inexpensive, easy-to-measure, and employs a simple, less invasive device. Its main drawback, other than the inability to measure valence, is temporal resolution. There is a lag, varying from 1 to 5 seconds, between the appearance of the stimulus and the phasic or skin conductance response (SCR). The resulting lack in granularity can make it difficult to disassociate stimuli from each other if they occur in close proximity in time.
Facial coding can tell us whether the emotional charge is positive, negative, or neutral at any given time. It also categorizes the expressions into one of the six or seven basic emotions.
A compelling advantage of facial coding is that, compared to other biometric techniques, it is much easier and cheaper to implement on a large scale. It uses only a webcam and requires no controlled location.
Electroencephalography (EEG) provides far better temporal resolution than either GSR or facial coding, allowing for highly granular diagnostic insights. It also yields a richer array of metrics that provide a measure of the level of fatigue, attention, engagement and workload. We can tell which parts of the brain are active while respondents perform a task or respond to stimuli.
Moreover, EEG is immune to masking — a respondent may fake a smile or mask their facial expressions, but the brain cannot be tricked. EEG is able to capture their true emotions.
It is however more invasive — 20 electrodes on the head versus 2 on the fingers. Note, however, that the electrodes are assembled in a manner that makes them quick and easy to place, and that respondents do not experience any discomfort.
In summary, biometrics work best in concert, each revealing different aspects of cognition, emotion and behaviour. The combinations to consider are eye tracking, GSR and facial expression, or eye tracking and EEG. Collectively these techniques provide a clear, multi-faceted understanding of respondents’ engagement with advertising. However, none of the techniques are able to dig into consumers thought processes. We still need qualitative and/or quantitative research to understand what is driving emotions, why something is appealing or why it is not. We still need directed, introspective questions to understand consumers’ purchase disposition, and their attitudinal engagement.
A hybrid approach using conventional copy testing with facial coding is likely to become the standard for pre-testing ads. Further combining with eye tracking and GSR/EEG, would yield deeper insights. Importantly because biometrics is quantifiable and accurate, it should significantly improve the predictive power of copy testing, especially for advertisements that rely on imparting an emotional charge.
A hybrid approach is also recommended for testing packaging where biometrics is increasingly used for assessing shelf impact as well engagement. Eye tracking is the preferred technique, especially for assessing shelf impact. It may be combined with EEG for evaluating engagement.
These applications are covered in detail in sections Shelf Impact — Eye Tracking and Biometrics — Engagement, in Chapter Packaging.
For product concept testing, EEG, eye tracking and/or GSR may be used with conventional qualitative techniques. EEG and facial coding can provide revealing insights in taste testing and sensory research. Measuring pupil dilation through eye trackers is also an option; as the saying goes, “the first taste is always with the eyes”.
For product usage, for instance driving a vehicle, or the use of apps, eye tracking and EEG are the best options.
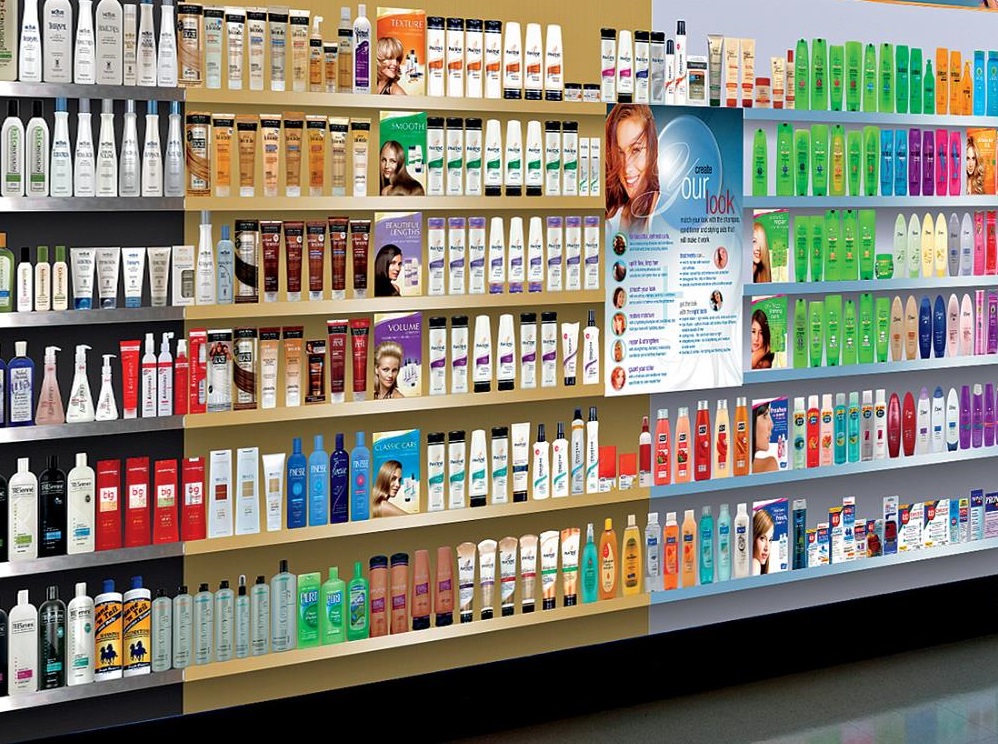
Biometric testing often requires specialized facilities located in central locations. For example, P&G’s “virtual wall” (Exhibit 15.24) is used to test packaging and simulates store shelves using 24 projectors. Similarly, GSK's “Shopper Science” lab (Exhibit 15.1) is another example of a specialized facility used for biometric testing.
Previous Next
Use the Search Bar to find content on MarketingMind.
Contact | Privacy Statement | Disclaimer: Opinions and views expressed on www.ashokcharan.com are the author’s personal views, and do not represent the official views of the National University of Singapore (NUS) or the NUS Business School | © Copyright 2013-2026 www.ashokcharan.com. All Rights Reserved.


