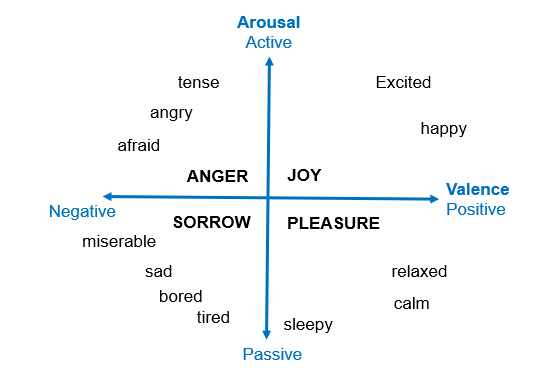
Exhibit 15.16 Physiological taxonomy of emotions.
Different service providers may use different terms
for EEG metrics, but these metrics generally correspond to cognitive-affective states such
as approach-avoidance behaviour, engagement and distraction, and cognitive workload. A
physiological taxonomy of emotions, as shown in Exhibit 15.16, depicts approach-avoidance
along the x-axis and cognitive state along the y-axis.
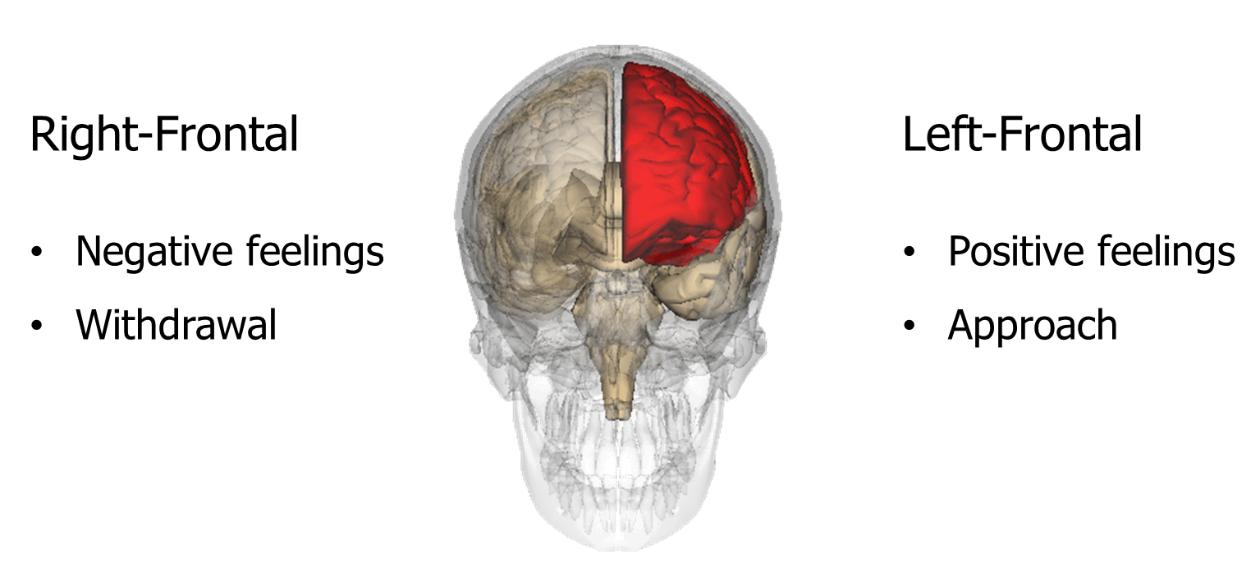
Exhibit 15.17 Activity in the left/right-frontal brain reveal approach-avoidance tendencies. (Source: adapted from iMotions,
image from Wikipedia).
The frontal asymmetry reveals insights into the subject’s
motivations, emotions and engagement. As depicted in
Exhibit 15.17, increased activity in the left-frontal indicates positive feelings, engagement and motivation, and the reverse
is true for the right-frontal. This relationship serves as a useful index of approach and avoidance:
$$ Frontal \,Asymmetry \,Index \,(FAI) = log \left(\frac {alpha \,power \,right \,F4}{alpha \,power \,left \,F3}\right) $$
A higher FAI typically indicates a positive disposition to stimuli, while a
lower index indicates a negative disposition. This metric is derived by extracting signals
from the electrodes F3/F4 and F7/F8.
In addition to the FAI, the beta (12-25 Hz) or gamma (> 30 Hz) band power,
particularly in the frontal cortical regions (electrodes F3 and F4), are good indicators
for the motivation towards (approach) or away from (avoidance) any stimulus.
These metrics are used for evaluating advertising and packaging, as well as
for product testing. They provide an unbiased indicator of the respondent’s emotional and
motivational disposition towards a new product.
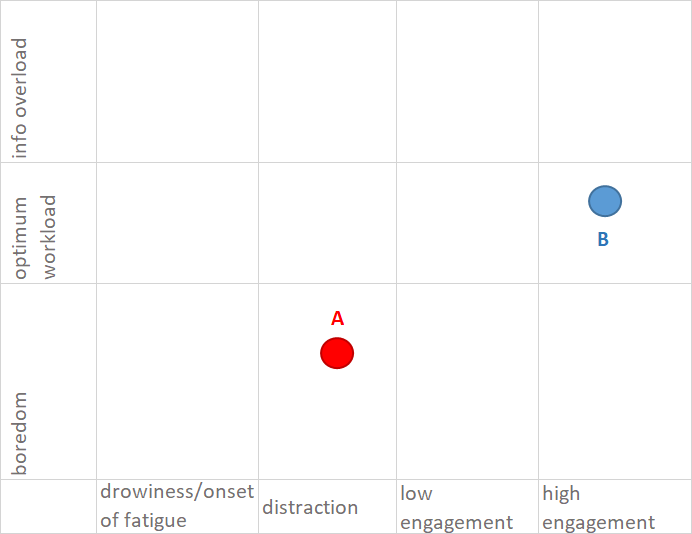
Exhibit 15.18 Cognitive-affective rating for two advertisements, based on scales used by Advanced Brain Monitoring’s B-Alert EEG.
Cognitive-affective metrics pertain to the cortical processes underlying mental workload or drowsiness. They
provide a measure of the level of fatigue, attention, engagement and workload that the respondent’s brain is
experiencing.
Cognitive States: Advanced Brain Monitoring’s (ABM) B-Alert EEG uses a scale ranging from 0 to 1 to
gauge the extent that the respondent is tuned-out/attentive. There are 4 cognitive states on this scale — drowsiness &
fatigue onset, distraction, low engagement and high engagement. Each of these states is characterized by different signals.
The signs of drowsiness and fatigue for instance include higher delta band activity and theta bursts.
Workload: ABM also adopts a workload scale, also from 0 to 1, that gauges cognitive processes
dealing with working memory, problem solving and analytical reasoning. There are 3 workload states — boredom, optimum and
stress/information overload. This scale correlates with theta band activity; as theta power increases, so does workload.
Plotted over the epochs, these metrics show how cognitive affective states change over the duration of a stimulus
such as a video advertisement.
The overall performance may be summarized by taking the averages across the epochs. This
allows for comparison across two or more stimuli. Exhibit 15.18, for instance, where ad B with high overall level of engagement
and optimum workload, out-performs ad A which is distracting and relatively boring.


