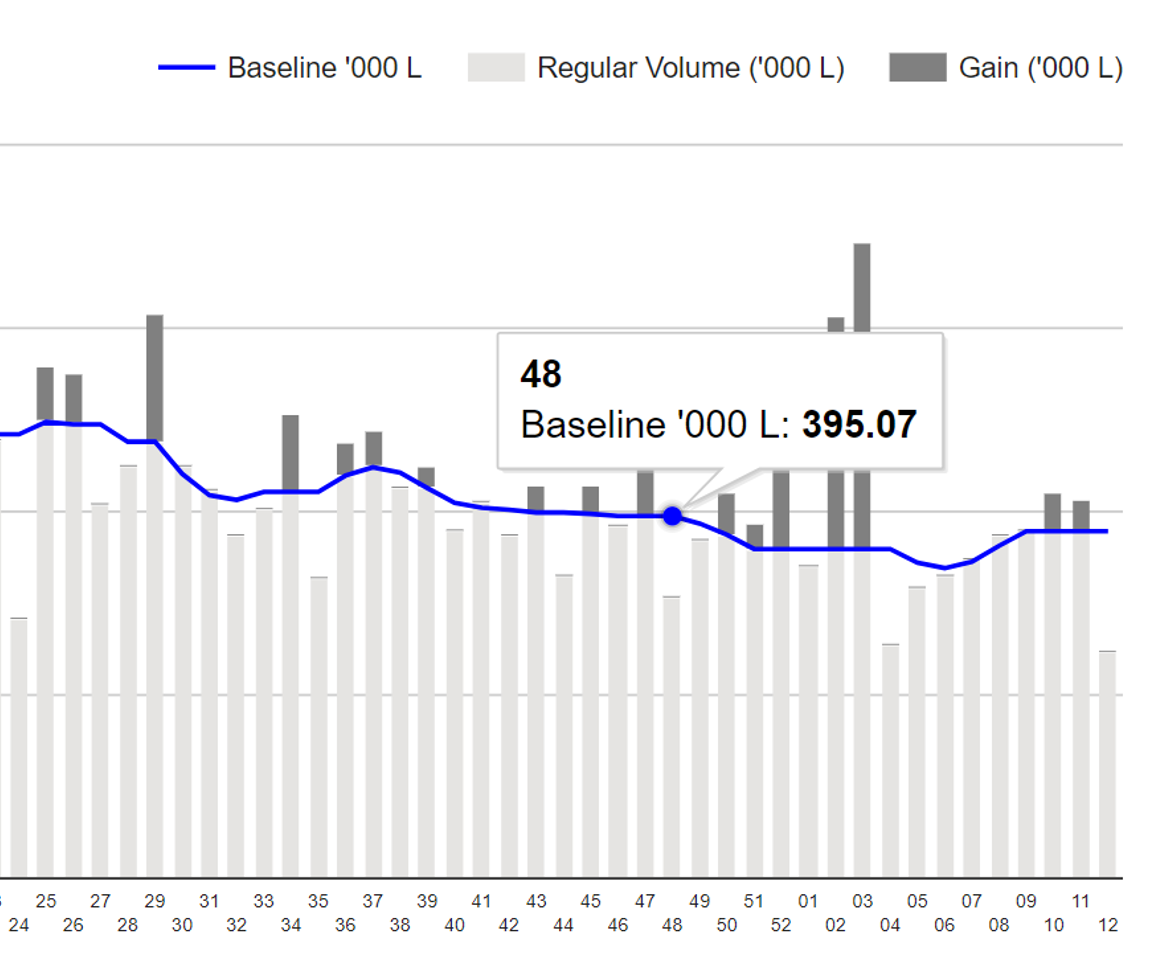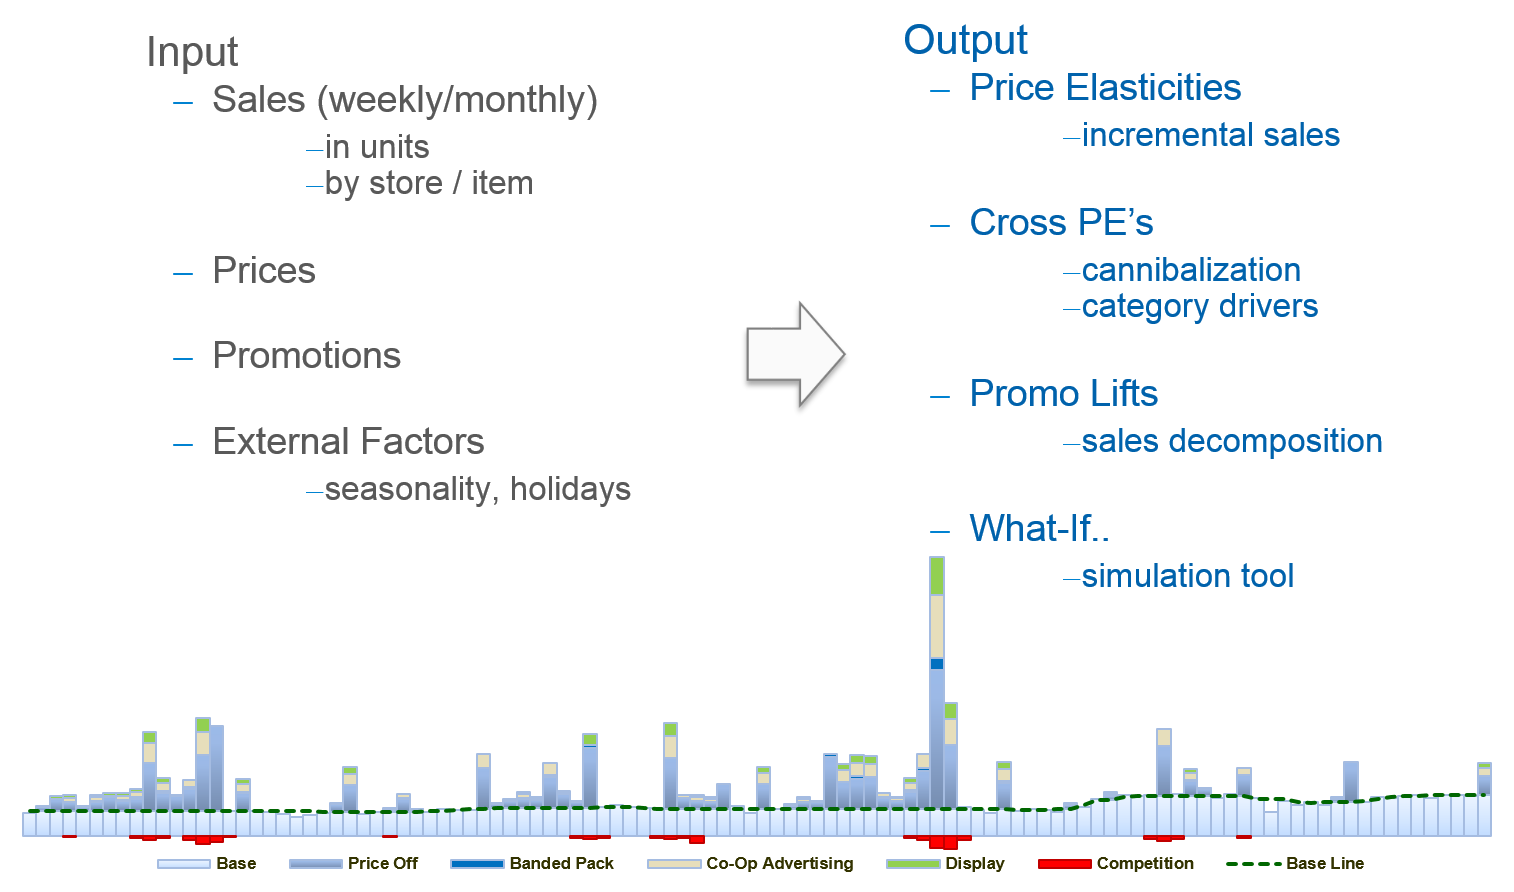
Exhibit 17.8 Overview of promotions response modelling.
The basic assessment of sales
promotions reveals the impact of the promotions on sales, revenue and
profitability. It does not however answer a number of critical questions, including the ones listed below:
- What elements of the promotion are more effective in driving
sales? What is the impact of the discount, the display, and the cooperative
advertisement?
- Does the promotion cannibalize manufacturer’s own brands? Or does
it “steal” share from competitor’s brands?
- To what extent does the promotion help build category volume?
- How much more volume could be gained if the discounts are further
increased?
- What is the optimum promo mix that maximizes sales volume without
incurring any loss in profit?
- Does the promotion draw incremental traffic into the store?
How much revenue and profit was generated from all of the purchases made by gained shoppers?
Econometric promotions response models yield answers to the first five questions posed
above, and the remaining question can be answered by retail analytics.
The outline of the econometric promotions response models, in terms of
inputs and outputs, is shown in Exhibit 17.8. These models analyse the data to
derive the impact of each individual element of a promotion on sales. The resulting sales
response functions yield estimates of discount elasticity of demand, discount cross
elasticity of demand, and sales lifts due to displays, co-op advertising and other causal
factors. It is possible to decompose sales into the elements contributing to the volume.
Promotion response models can also forecast what impact a possible combination of
initiatives will have on sales.