Instagram Insights, accessible from mobile only, is a key
benefit of having a professional profile. It provides insights into how user content is performing on
the network. This helps users improve their marketing initiatives and tweak their marketing strategy.
- Date Range is the timeframe for the data on the screen. The default date
range is ‘Last 7 Days’. Other pre-set timeframes include ‘Last 30 Days’, ‘Previous Month’ and
‘Last 90 Days’.
- Accounts Reached is the number of unique users who viewed the content.
- Impressions is the number of times the content was viewed — including
repeat views by the same users.
- Accounts Engaged refers to the number of unique users who interacted with
the content in some way other than just scrolling past it. Interactions include likes, saves,
comments, shares and replies.
- Followers (Total Followers) is the number of people who follow the user.
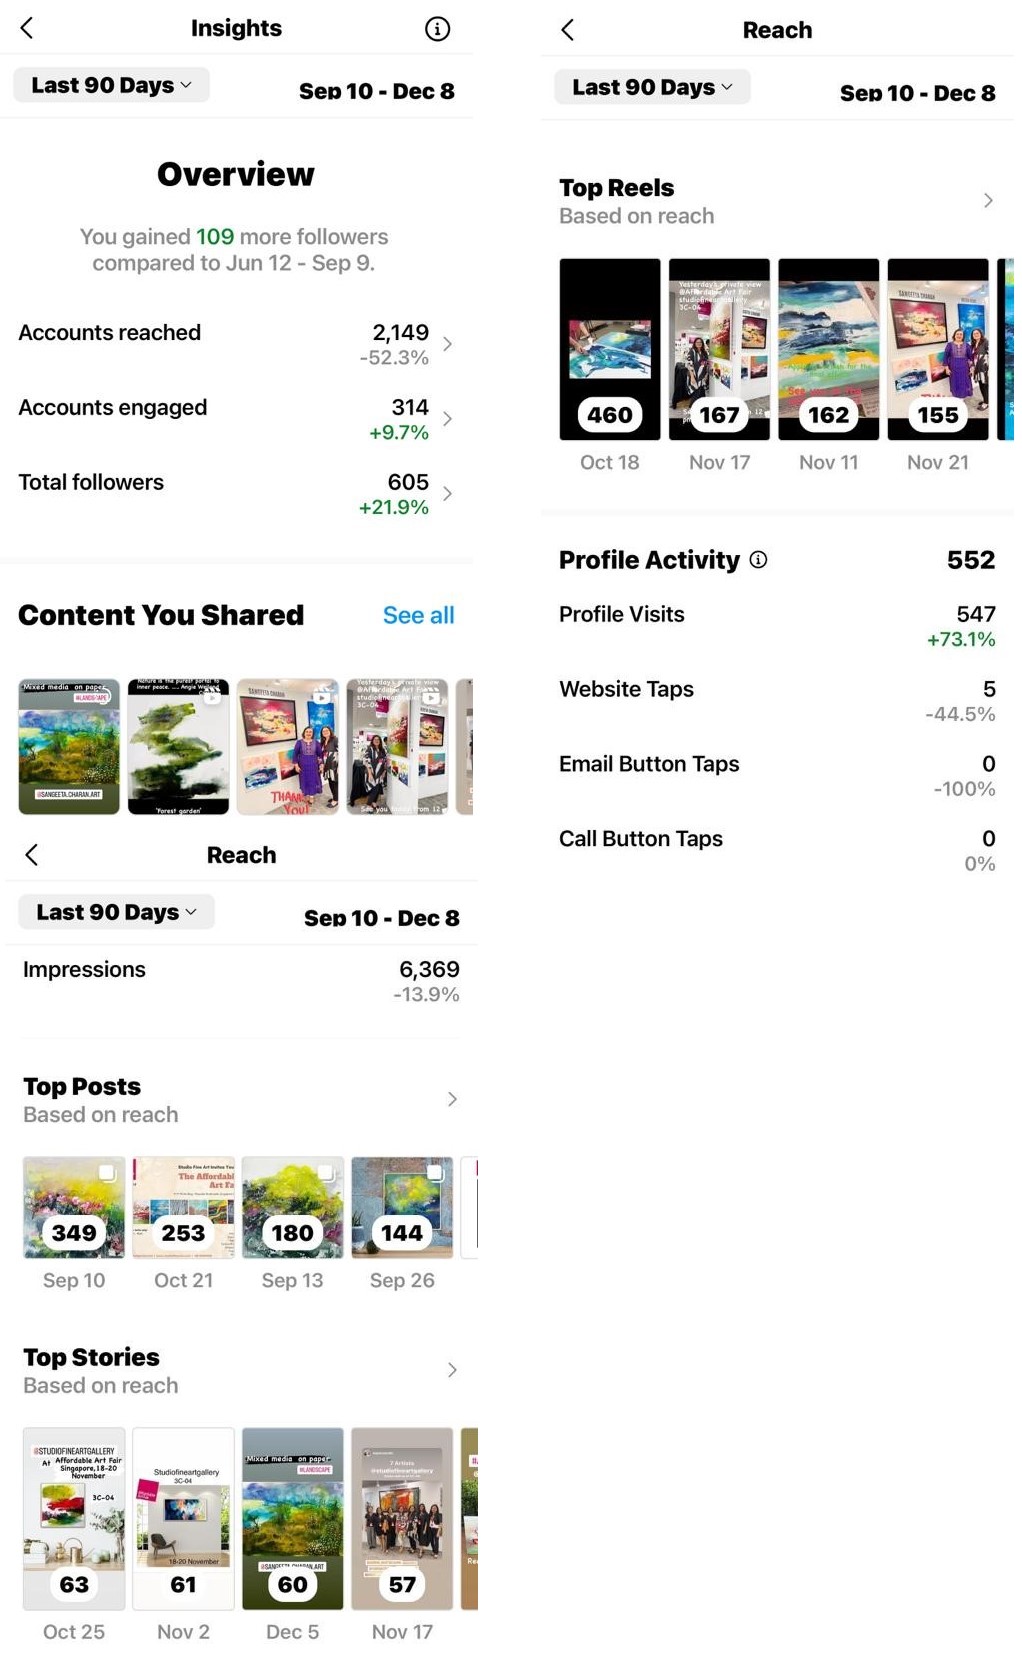
Exhibit 22.10 Insights overview, ‘Contents You Shared’ and ‘Profile Activity’.
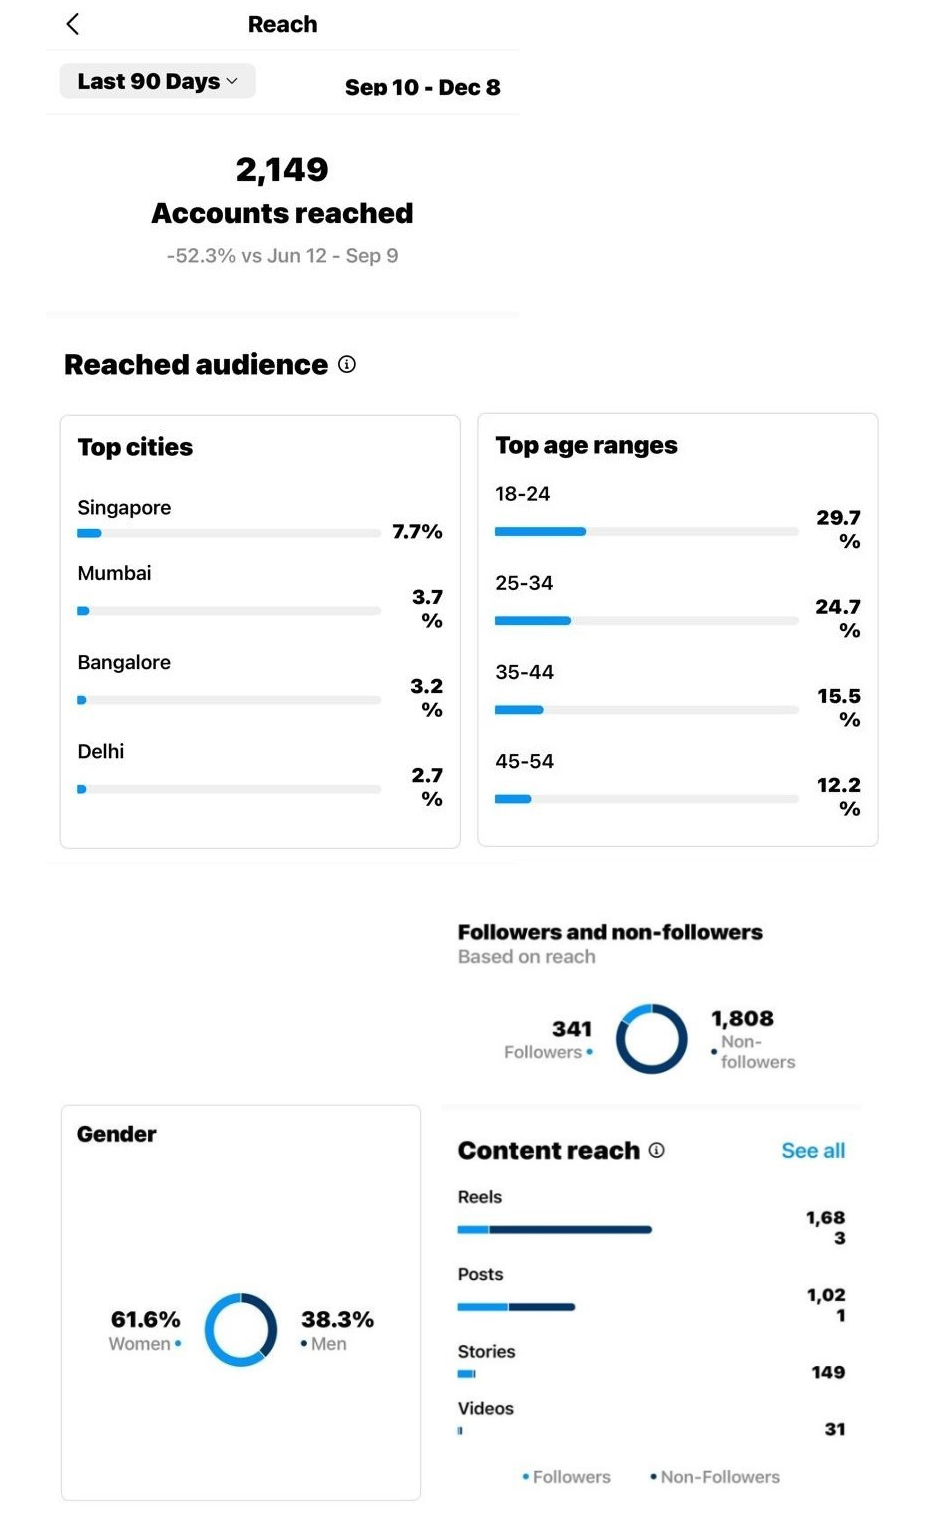
Exhibit 22.11 Insights overview — Reached audience.
Insights Overview (exhibits 22.10 and 22.11)
provides insights on overall performance covering all content — posts, Stories, Reels, videos,
live videos, and promoted ads. Metrics include accounts reached, accounts engaged, total followers
and approximate earnings (if applicable).
Section ‘Content You Shared’ (Exhibit 22.10) displays the posts, Stories,
Reels, videos and live videos and promotions that the user shared, and the top-performing posts
based on reach.
‘Profile Activity’ breaks down the actions taken by users when they visit the profile
page. The actions include profile visits, website taps, business address taps, call button taps,
email button taps, and text button taps. (Only those action buttons that have been set up will
show up).
The ‘Reached audience’ (Exhibit 22.11) section provides a geographic (cities,
countries), demographic (age, gender) and follower status break-up of the audience, i.e., accounts
reached.
The ‘Engaged audience’ section shows how many unique users engaged (liked, commented,
saved, shared, or replied) with the content. This is broken down by follower status, gender, age,
countries, and cities.
The ‘Content interactions’ section reveals the number of times users engaged with
content. It is also broken down by posts.
The ‘Most active times’ section shows the hours and days that followers are most often
on Instagram. This allows marketers to determine when they can engage with most of their followers.
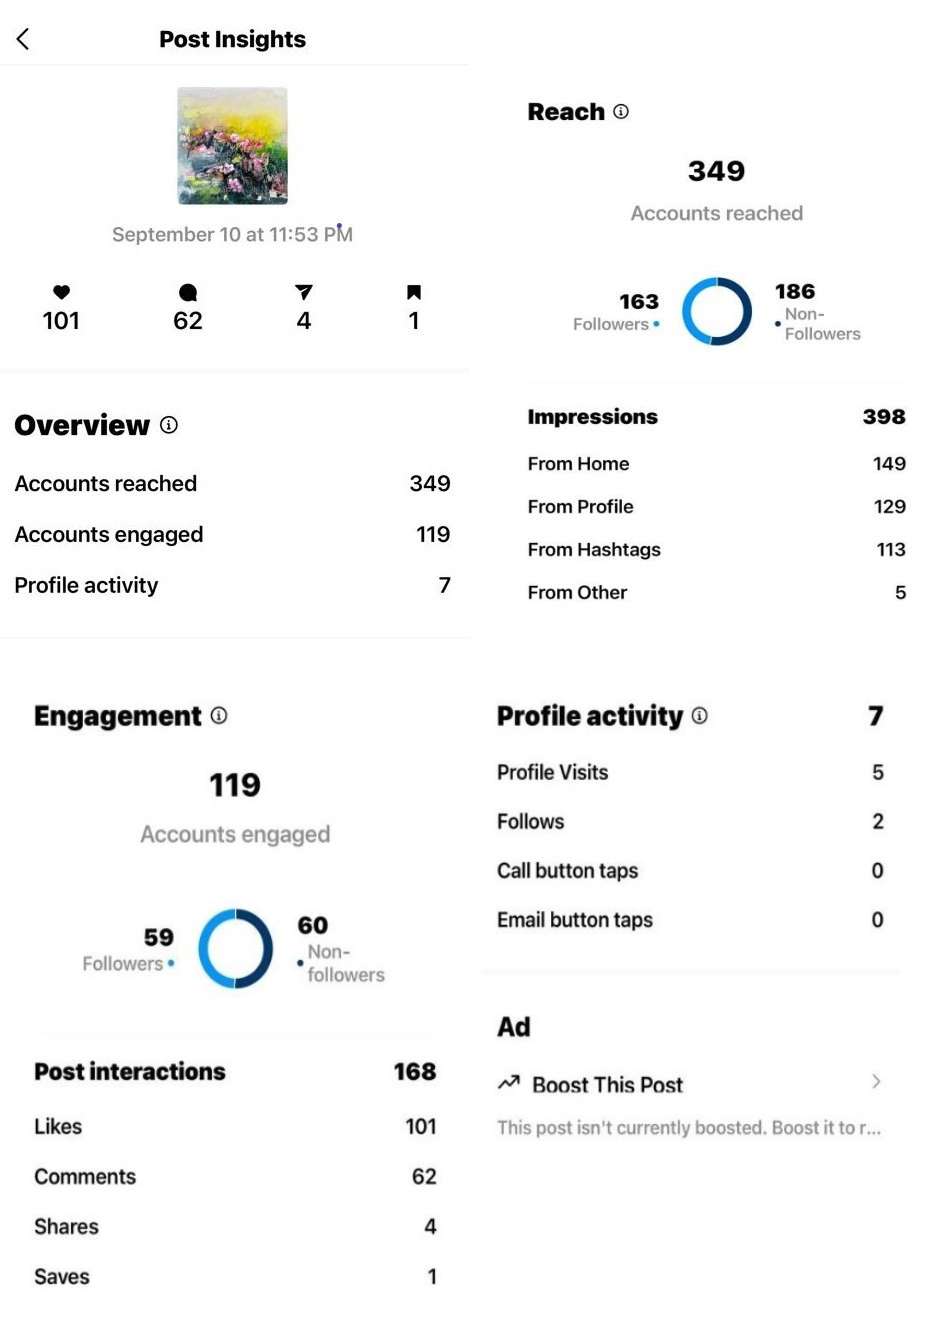
Exhibit 22.12 Insights for a post.
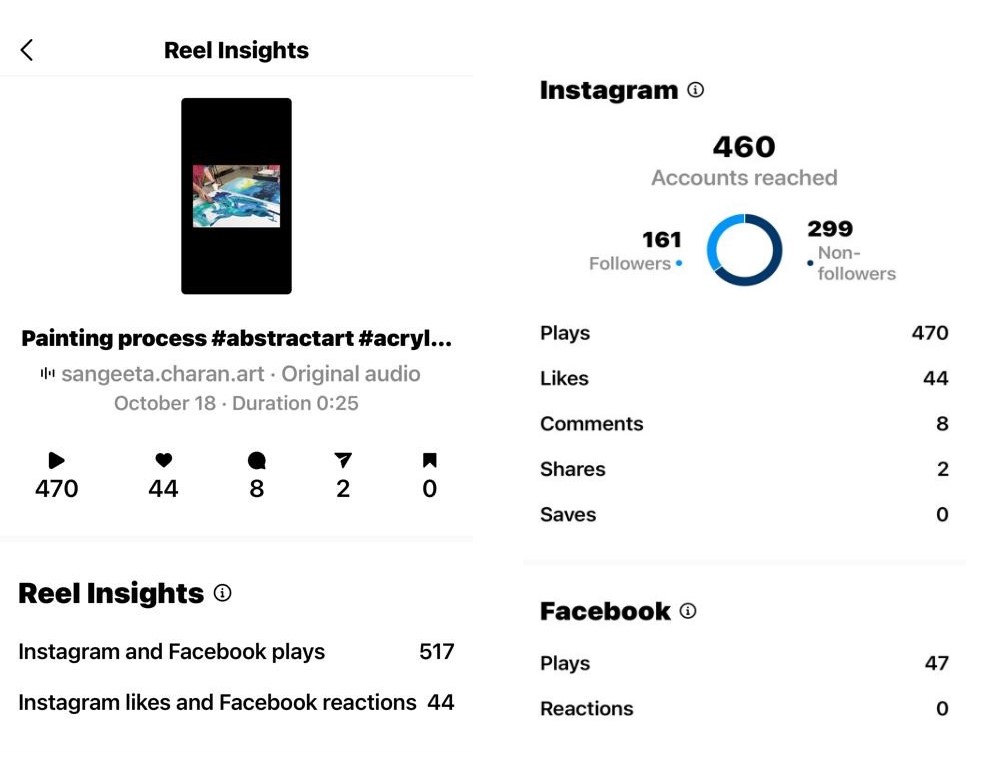
Exhibit 22.13 Insights for a reel.
As shown in exhibits 22.12 and 22.13, with
Instagram Insights users can select any specific content — post, Reel, Story, video or live video —
and review the content’s performance in terms of the reach, impressions and engagement metrics, with
break-up across followers and non-followers.
This provides marketers an understanding of how their content is performing so that
they can learn how to improve it.


