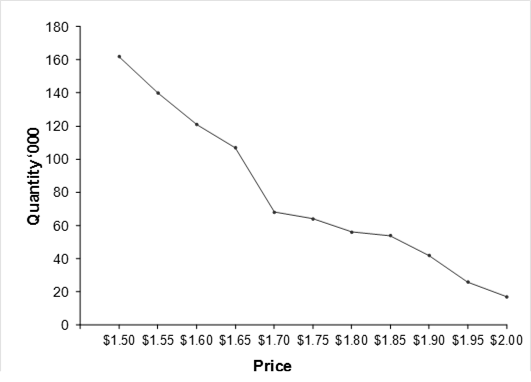
Exhibit 16.4 Buy response curve derived using Gabor–Granger method.
In the Gabor-Granger method, respondents are presented
with the product/service, along with contextual information, and asked their
likelihood, on a 5-point scale, to purchase at different price points.
The data can reveal price thresholds beyond which the demand falls sharply. For instance, the output
depicted in Exhibit 16.4 reveals a kink in demand at $1.65. When price is
increased from 1.65 to 1.70, sales plunge by roughly 40%.
Though they are not commonly observed, kinks are known to arise due to factors relating
to competitive response. For instance, if government duties go up for products
such as petroleum or cigarettes, if only a minority of suppliers take prices
up, they will experience a sharper than expected fall in demand.
On the other hand,
if a company takes successive price rises (or drops),
it will experience relatively smaller losses (or gains) in volume if these adjustments are in sync with its competitors.
Gabor–Granger is a simple, speedy technique that
provides rough estimates. It may be used as ballpark for products where
direct comparison of competitor offerings is not realistic.
In addition to not considering the competitive landscape, the Gabor-Granger
method is susceptible to bias caused by consumers becoming more sensitive to price. This is
a common issue with methods that present respondents with various price options for the same
product offering. As respondents become more sensitive to price, their response to price
changes may become overstated. To avert this, researchers can use monadic tests where each
respondent is asked for only one price, and prices are varied among different respondents in
the overall sample. However, monadic tests require larger samples, which will result in higher
costs.


