Brand price trade-off (BPTO) employs
a relatively simple direct approach to gain insights into consumers’
sensitivity to price in a competitive purchase scenario.
Method
The study is usually
conducted online or at a central location. The respondent is presented
repeatedly with choice of brands relevant to their purchase decision.
The prices vary, starting at the lowest level of the test range, and
moving upwards as the exercise progresses.
At each step the respondent is asked to choose
from a set of brand/price options. After the respondent chooses an option, the
price for the chosen brand is increased to the next price point while that for
the other brands remains unchanged. Respondent is then asked to make their next
choice, and the exercise continues till all options are exhausted.
Consider the example in Exhibit 16.6 for a range of
cars with similar specifications, targeting the same consumer segment. The
exhibit reflects the choices made by a particular respondent, from the start to
the end of the exercise. This respondent is less sensitive to price
compared to the respondent in Exhibit 16.7 who switches brands 13 times over
the price range.
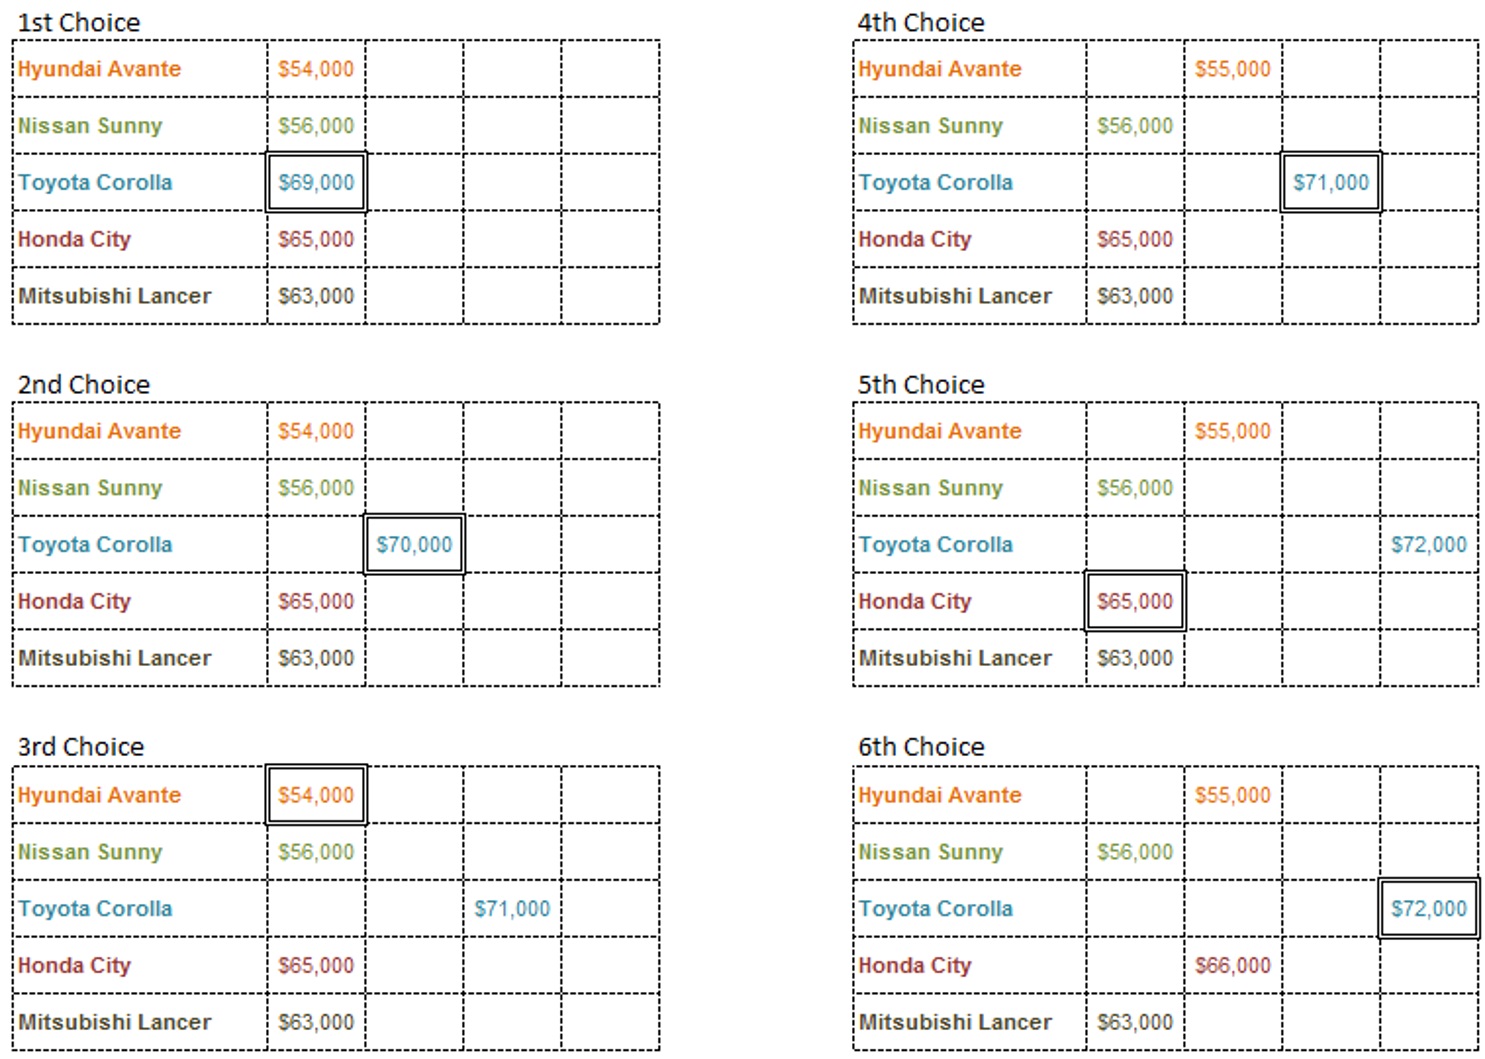
Exhibit 16.6 A BPTO answer sequence (fictitious example).
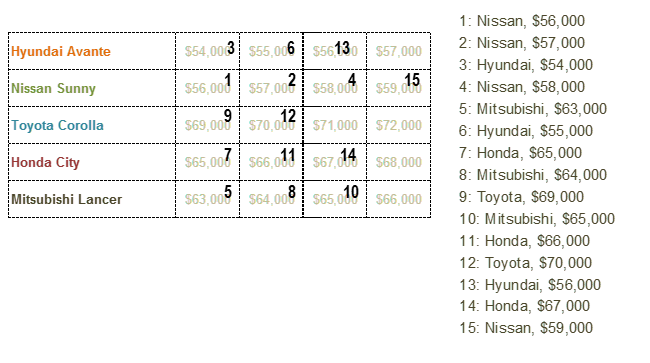
Exhibit 16.7 Example of hierarchy of choices for a price
sensitive respondent.
Analysis
The analysis method
commonly used, called Essential Rank Analysis, is
based on each respondent’s hierarchy of choices. For illustration consider the
following brand/price options:
| Brand | Price |
|---|
| Honda | $66,000 |
|---|
| Toyota | $70,000 |
|---|
| Hyundai | $54,000 |
|---|
| Nissan | $58,000 |
|---|
| Mitsubishi | $66,000 |
|---|
For the respondent whose choices are listed in Exhibit
16.6, Honda $66,000 brand/price option ranks 11th, Toyota $70,000
ranks 12th, Hyundai $54,000 ranks 3rd, Nissan $58,000 ranks 4th,
and Mitsubishi $66,000 is not ranked. This respondent, for the options
listed above, will therefore choose Hyundai $54,000, as it lies
uppermost in their hierarchy of choices.
In a similar manner, the highest-ranking choice is
taken for all respondents, and projected to provide an estimate of the brands’
share at the mentioned price points, as well as for the other price points
covered in the study. This yields the demand price relationships for the
brands, which may be used to estimate price elasticity and cross price
elasticity of demand at the price points of interest to the marketer.
BPTO can be modified to allow for gauging consumers’
sensitivity to downward price movements. This is useful for markets where
consumers’ sensitivity to an increase in price may differ from their
sensitivity to a reduction in price.
Limitations
When estimating volume, like other pricing research
methods, BPTO makes several assumptions. It assumes that consumers have perfect knowledge
and awareness of products, and that other elements of the marketing mix, in particular
distribution and promotions, do not change.
Importantly too, BPTO measures
preference, not volume. For instance, in FMCG where consumers purchase a
repertoire of brands, estimates of volume are likely to be less accurate. A
consumer, for instance, in overall terms, may prefer Sunsilk shampoo over
Pantene or Head & Shoulders, but she could be using all three products.
BPTO is less widely used nowadays because the way BPTO is conducted, heightens
awareness that the exercise relates to pricing. As respondents become sensitized to price,
their claimed response to price changes is considerably overstated. Hence, unless the data is
normalized to correct for overstatement, the use of BPTO for making pricing decisions is not
recommended. On the other hand, studies that use discrete choice models (refer section
Discrete Choice Modelling),
mirror the real world more closely, and yield responses that more accurately reflect consumers’
true behaviour.


