Sensory attributes are
product properties perceived by one or more of the five senses: visual, tactile (mouth, skin, surface
texture, etc.), auditory (crunch, squeak), olfaction
(taste, flavour, smell) and kinaesthetic
(including feelings such as cooling, burning, and tingling associated with use
of a product).
Sensory research is concerned with objectively
rating the sensorial attributes of a product using respondents who possess
sensory acuity. These respondents can detect sensory properties and are able
to describe them well. They need not be the target market for the product; their
role is to provide an objective assessment of the sensorial makeup of the
product, something that average consumers are not usually good at. While
consumers are good at telling us what they like and dislike, they often struggle
to discern and describe sensory attributes.
Sensory research is often used in conjunction with
consumers’ rating of products to provide an explanation of consumers’
preferences. For example, if consumers highly rate the smell of a product (“I
really like it” or “I like it extremely”), sensory profiling explains what they
like about the smell.
Sensory Profiling
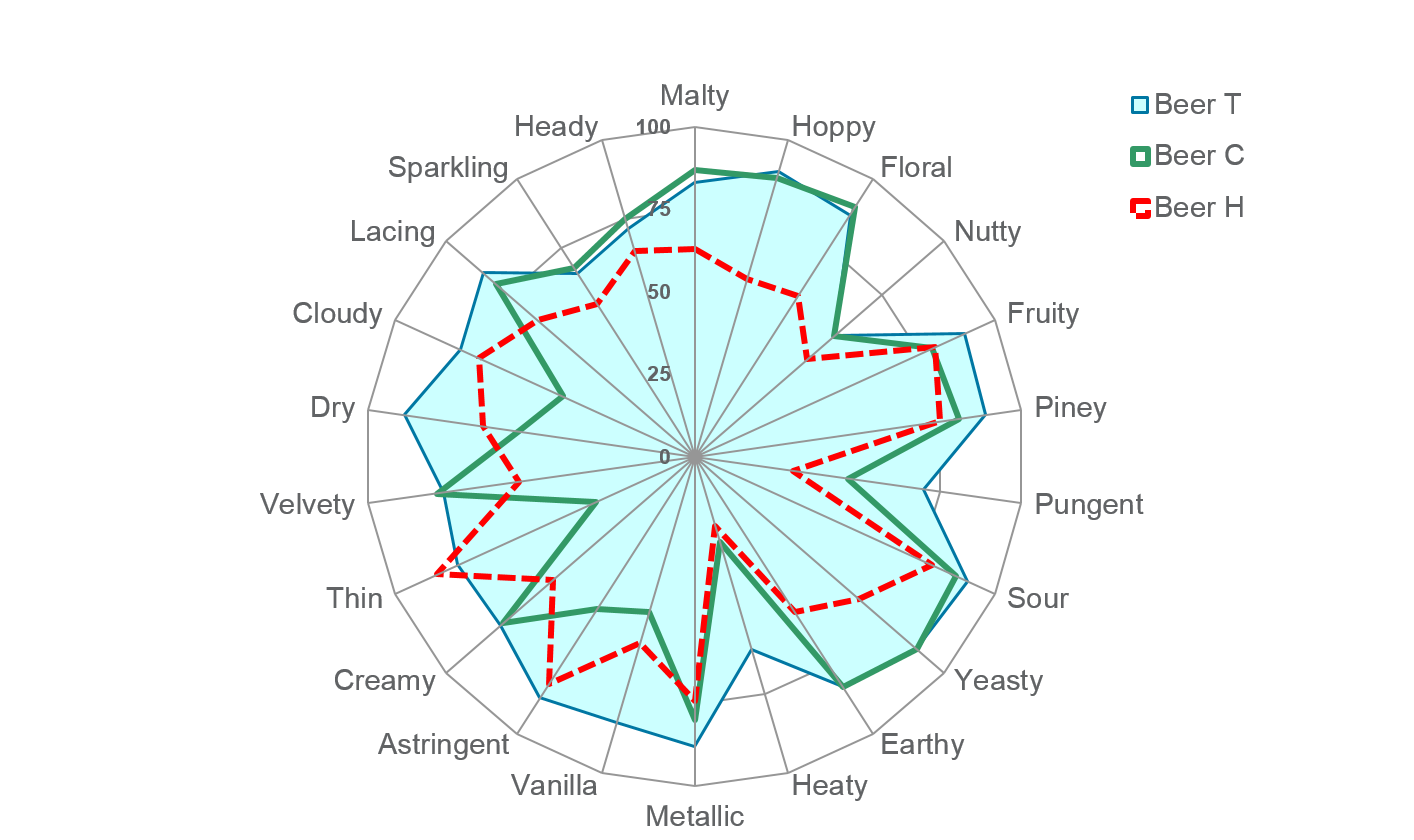
Exhibit 10.2 Sensory profiling of beer brands T, C and H.
Spider charts such as the one shown
in Exhibit 10.2, are often used to depict the sensory profile of products. They
relate how the product is perceived on the sensory attributes that are
associated with the category.
The technique commonly used for sensory profiling
is called Quantitative Descriptive Analysis (QDA).
Listed below are the steps involved in the QDA process:
- Build Attribute list: A sensory panel of about a dozen
participants collectively try all products included in the test. Words used by
the panellists to describe the sensorial constitution (i.e., visual, tactile, auditory, olfaction and kinaesthetic) of these products
are recorded, and a list of descriptors of the sensory attributes is finalized.
- Product Rating: In a blind (unbranded) test, products are rated
individually by the panellists on each of the sensory attributes. The
assessment is typically repeated at least once to check for consistency of the
ratings. The average rating of each brand is then charted as shown in Exhibit
10.2.
Using correspondence analysis or principal component analysis (PCA), the
brands and their image ratings can also be vividly depicted on a
multidimensional perceptual map.


